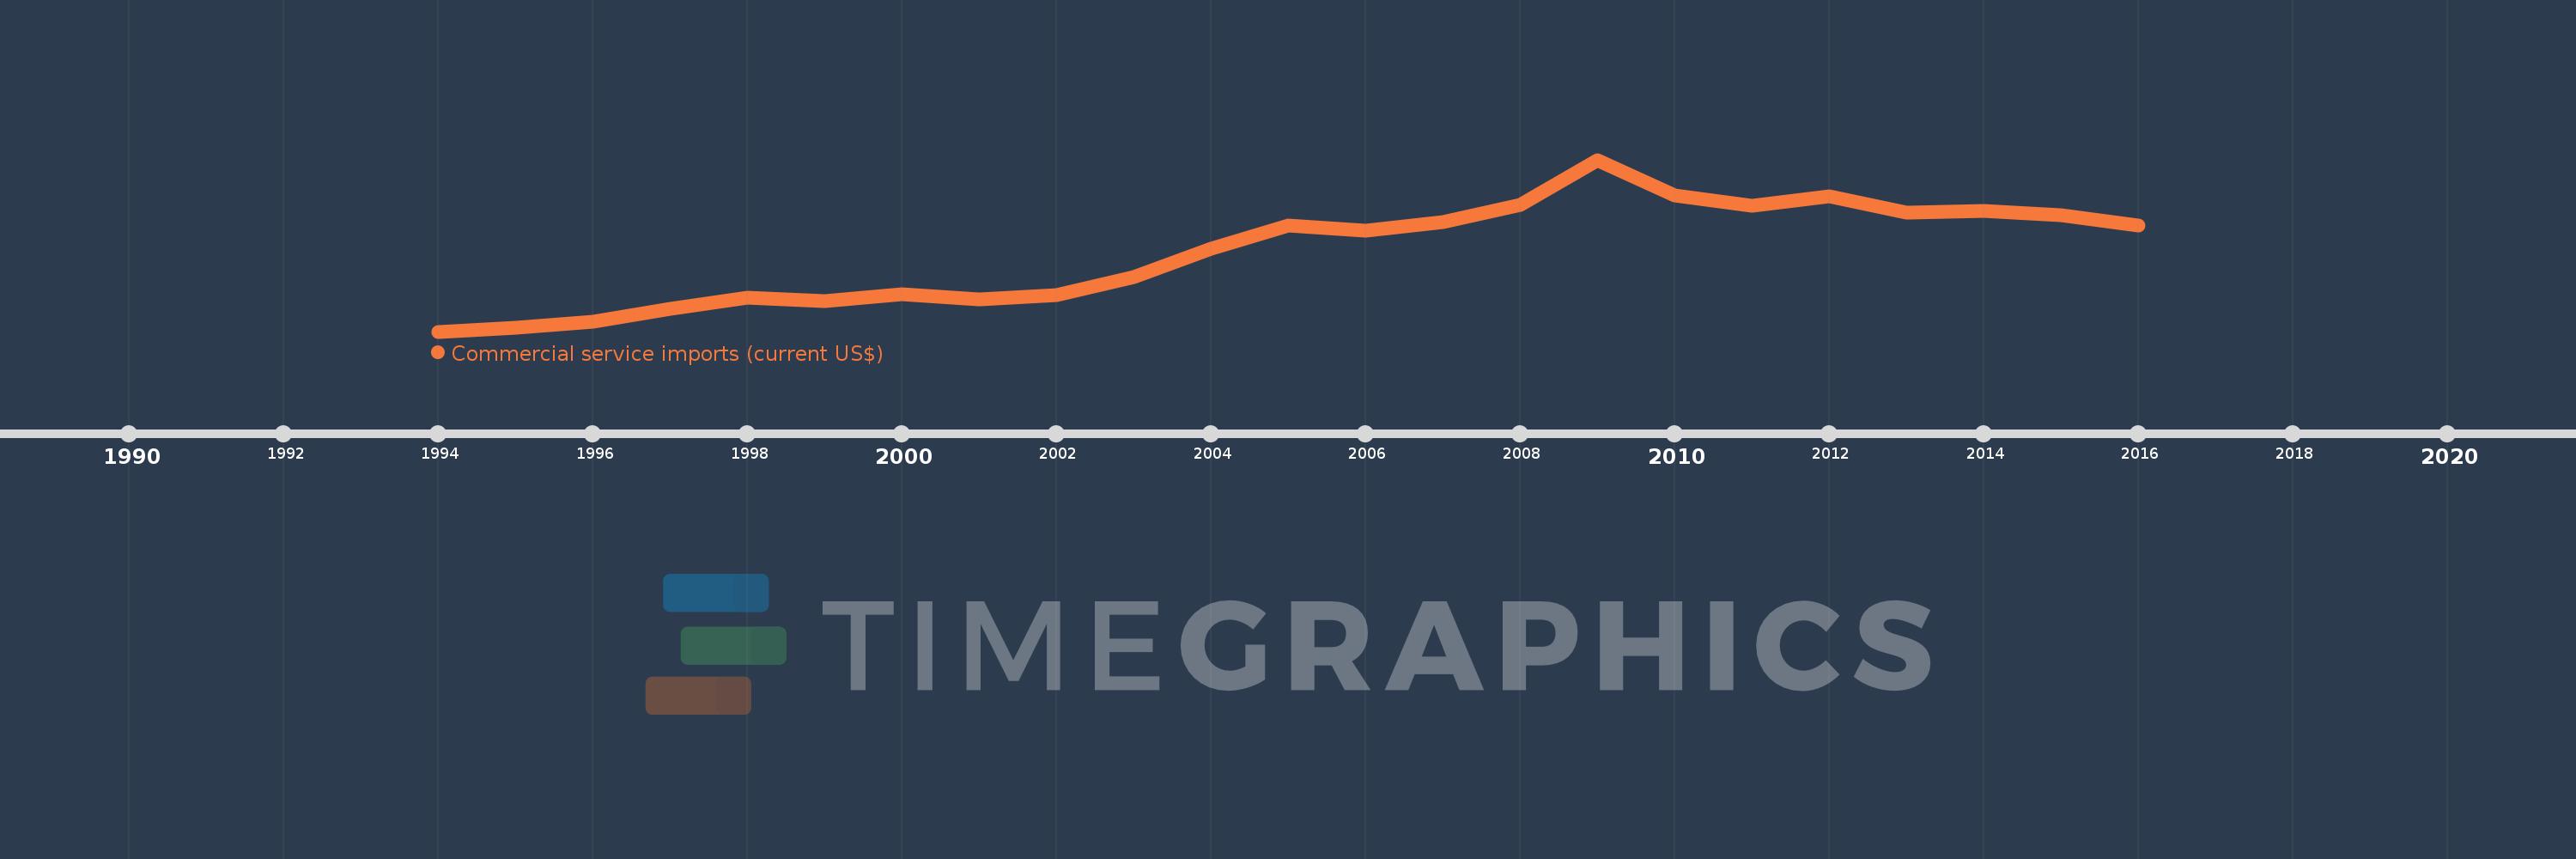
Cette échelle de temps montre un graphique de 1994 année à 2016 année Croatia. Les données jusqu'à 1993 année ne sont pas présentés. Quantité d'observations actuelles selon dates: 23.
Source (désignation):
Les indicateurs du développement mondiale
Source (organisation):
International Monetary Fund, Balance of Payments Statistics Yearbook and data files.
Catégories:
Private Sector, Trade
Dernière mise à jour
23 avr. 2017
Les indicateurs de changement de valeurs selon les années
En moyenne:
3.029 mds
Minimum:
1.146 mds
1 janv. 1994
Maximum:
5.237 mds
1 janv. 2009
Pour la date d''observation
Valeur
Changement absolu
Le changement par rapport à la valeur précédente
1 janv. 1994
1.146 mds
+1.146 mds
0.0%
1 janv. 1995
1.229 mds
+82.982 mln.
7.24%
1 janv. 1996
1.373 mds
+144.068 mln.
11.72%
1 janv. 1997
1.69 mds
+316.514 mln.
23.05%
1 janv. 1998
1.964 mds
+274.069 mln.
16.22%
1 janv. 1999
1.877 mds
-86.886 mln.
-4.42%
1 janv. 2000
2.037 mds
+160.422 mln.
8.55%
1 janv. 2001
1.916 mds
-120.828 mln.
-5.93%
1 janv. 2002
2.019 mds
+102.384 mln.
5.34%
1 janv. 2003
2.439 mds
+420.085 mln.
20.81%
1 janv. 2004
3.128 mds
+688.995 mln.
28.25%
1 janv. 2005
3.68 mds
+551.692 mln.
17.64%
1 janv. 2006
3.54 mds
-139.831 mln.
-3.8%
1 janv. 2007
3.754 mds
+214.688 mln.
6.07%
1 janv. 2008
4.158 mds
+403.531 mln.
10.75%
1 janv. 2009
5.237 mds
+1.079 mds
25.94%
1 janv. 2010
4.379 mds
-857.668 mln.
-16.38%
1 janv. 2011
4.145 mds
-234.342 mln.
-5.35%
1 janv. 2012
4.367 mds
+222.644 mln.
5.37%
1 janv. 2013
3.97 mds
-397.469 mln.
-9.1%
1 janv. 2014
4.022 mds
+52.511 mln.
1.32%
1 janv. 2015
3.924 mds
-98.841 mln.
-2.46%
1 janv. 2016
3.678 mds
-245.102 mln.
-6.25%
Classement des pays selon les statistiques actuelles par années