33
/fr/
AIzaSyAYiBZKx7MnpbEhh9jyipgxe19OcubqV5w
August 1, 2025
76634
Bahamas, The
BHS
true
2
1
School enrollment, secondary (gross), gender parity index (GPI)
2011,2010,2009,2008,2007,2006,2005,2003,2000,1998,1996,1994,1993,1988,1987,1986,1984,1983
Download
Bibliothèque de statistiques globales →Bahamas, The →

School enrollment, secondary (gross), gender parity index (GPI)

Cette statistique dans les autres pays:

AfghanistanAlbaniaAlgeriaAndorraAngolaAntigua and BarbudaArab WorldArgentinaArmeniaArubaAustraliaAustriaAzerbaijanBahamas, TheBahrainBangladeshBarbadosBelarusBelgiumBelizeBeninBermudaBhutanBoliviaBosnia and HerzegovinaBotswanaBrazilBrunei DarussalamBulgariaBurkina FasoBurundiCabo VerdeCambodiaCameroonCanadaCaribbean small statesCentral African RepublicCentral Europe and the BalticsChadChileChinaColombiaComorosCongo, Dem. Rep.Congo, Rep.Costa RicaCote d'IvoireCroatiaCubaCuracaoCyprusCzech RepublicDenmarkDjiboutiDominicaDominican RepublicEarly-demographic dividendEast Asia & PacificEast Asia & Pacific (excluding high income)East Asia & Pacific (IDA & IBRD countries)EcuadorEgypt, Arab Rep.El SalvadorEquatorial GuineaEritreaEstoniaEthiopiaEuro areaEurope & Central AsiaEurope & Central Asia (excluding high income)Europe & Central Asia (IDA & IBRD countries)European UnionFijiFinlandFragile and conflict affected situationsFranceGabonGambia, TheGeorgiaGermanyGhanaGreeceGrenadaGuatemalaGuineaGuinea-BissauGuyanaHeavily indebted poor countries (HIPC)High incomeHondurasHong Kong SAR, ChinaHungaryIBRD onlyIcelandIDA & IBRD totalIDA blendIDA onlyIDA totalIndiaIndonesiaIran, Islamic Rep.IraqIrelandIsraelItalyJamaicaJapanJordanKazakhstanKenyaKiribatiKorea, Dem. People’s Rep.Korea, Rep.KuwaitKyrgyz RepublicLao PDRLate-demographic dividendLatin America & Caribbean Latin America & Caribbean (excluding high income)Latin America & the Caribbean (IDA & IBRD countries)LatviaLeast developed countries: UN classificationLebanonLesothoLiberiaLibyaLiechtensteinLithuaniaLow & middle incomeLow incomeLower middle incomeLuxembourgMacao SAR, ChinaMacedonia, FYRMadagascarMalawiMaldivesMaliMaltaMarshall IslandsMauritaniaMauritiusMexicoMicronesia, Fed. Sts.Middle East & North AfricaMiddle East & North Africa (excluding high income)Middle East & North Africa (IDA & IBRD countries)Middle incomeMoldovaMongoliaMontenegroMoroccoMozambiqueMyanmarNamibiaNauruNepalNetherlandsNew ZealandNicaraguaNigerNigeriaNorth AmericaNorwayOECD membersOmanOther small statesPacific island small statesPakistanPalauPanamaPapua New GuineaParaguayPeruPhilippinesPolandPortugalPost-demographic dividendPre-demographic dividendPuerto RicoQatarRomaniaRussian FederationRwandaSamoaSan MarinoSao Tome and PrincipeSaudi ArabiaSenegalSerbiaSeychellesSierra LeoneSlovak RepublicSloveniaSmall statesSolomon IslandsSomaliaSouth AfricaSouth AsiaSouth Asia (IDA & IBRD)SpainSri LankaSt. Kitts and NevisSt. LuciaSt. Vincent and the GrenadinesSub-Saharan Africa Sub-Saharan Africa (excluding high income)Sub-Saharan Africa (IDA & IBRD countries)SudanSurinameSwazilandSwedenSwitzerlandSyrian Arab RepublicTajikistanTanzaniaThailandTimor-LesteTogoTongaTrinidad and TobagoTunisiaTurkeyTurkmenistanTuvaluUgandaUkraineUnited Arab EmiratesUnited KingdomUnited StatesUpper middle incomeUruguayUzbekistanVanuatuVenezuela, RBVietnamWest Bank and GazaWorldYemen, Rep.ZambiaZimbabwe

La ligne de temps

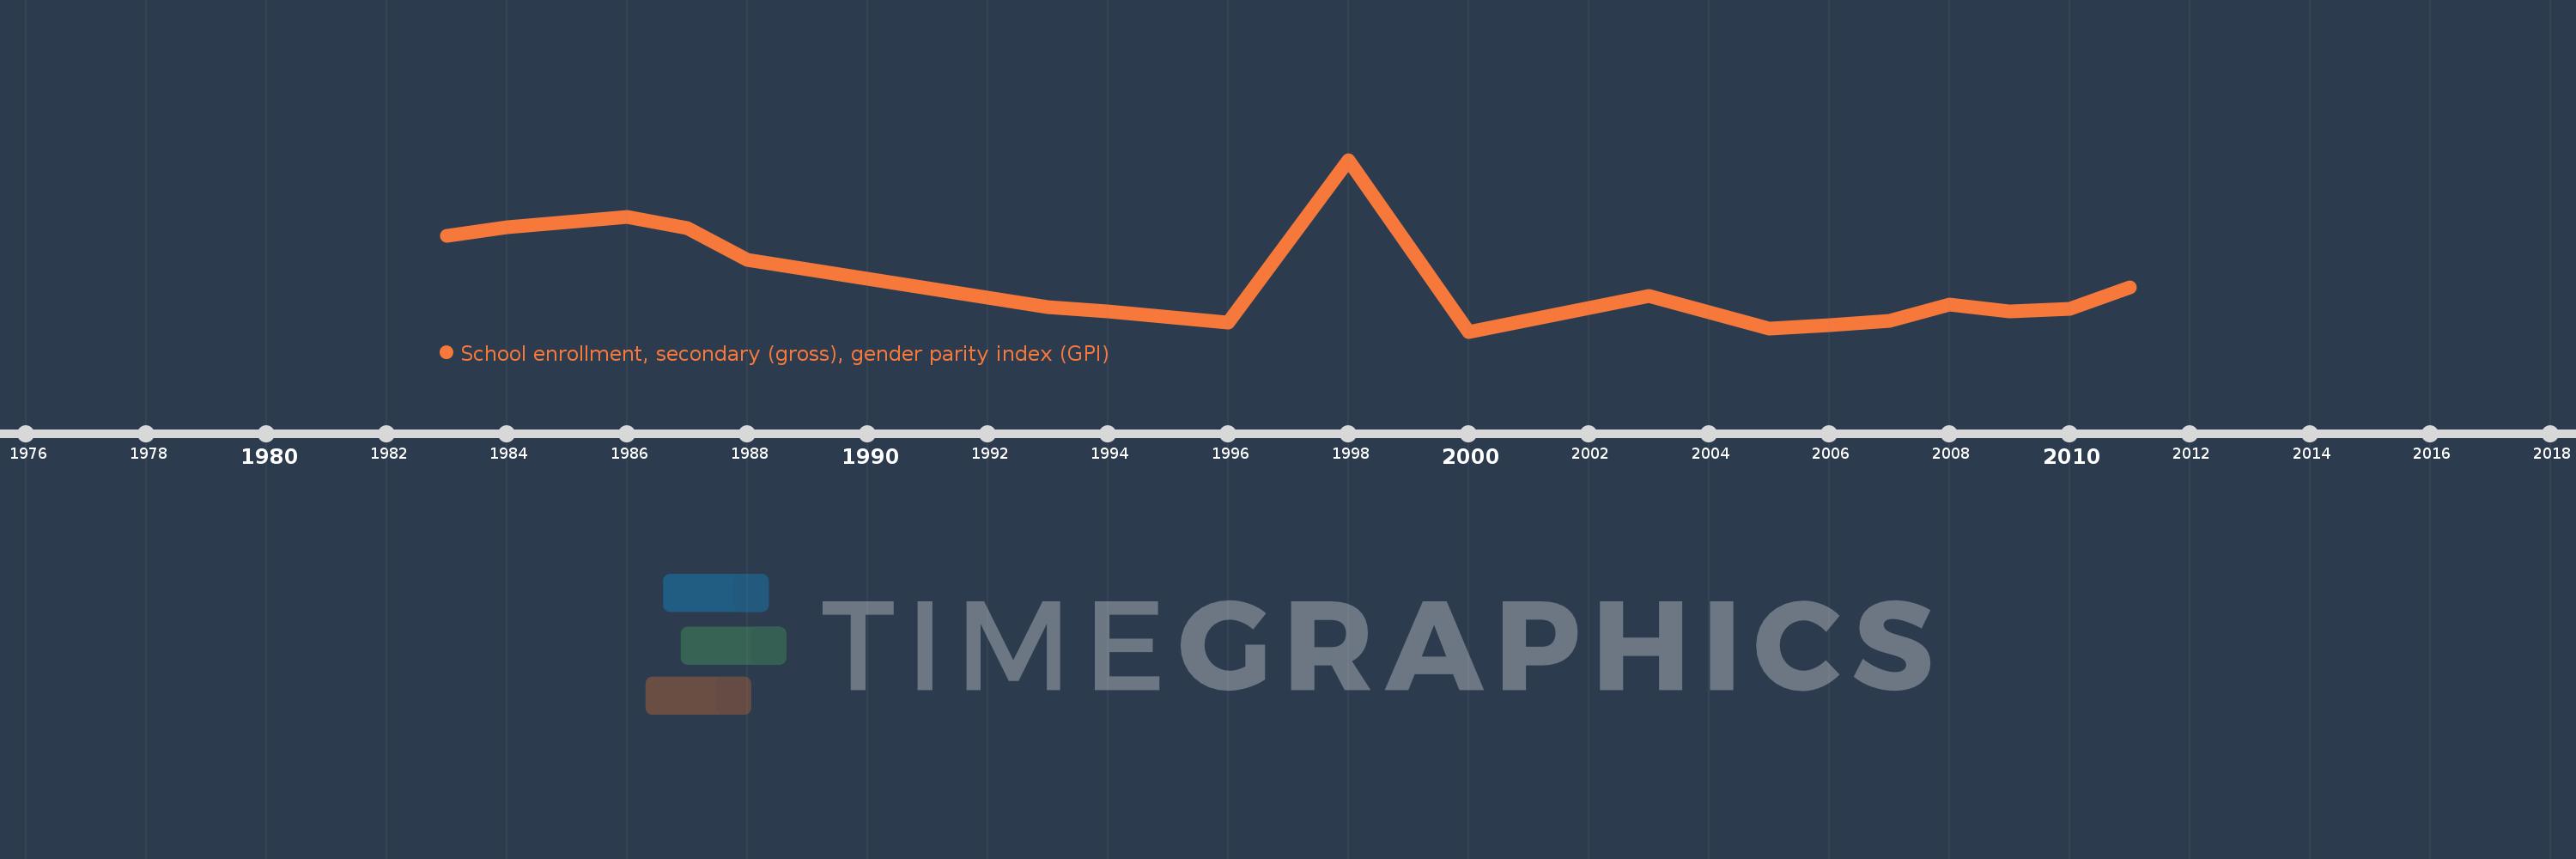
Cette échelle de temps montre un graphique de 1983 année à 2011 année Bahamas, The. Les données jusqu'à 1982 année ne sont pas présentés. Quantité d'observations actuelles selon dates: 18.

Source (désignation):

Les indicateurs du développement mondiale

Source (organisation):

United Nations Educational, Scientific, and Cultural Organization (UNESCO) Institute for Statistics.

Catégories:

Education, Gender, Social Development

Dernière mise à jour

23 avr. 2017

Les indicateurs de changement de valeurs selon les années

En moyenne:
1.061
Minimum:
0.986
1 janv. 2000
Maximum:
1.249
1 janv. 1998
Pour la date d''observation
Valeur
Changement absolu
Le changement par rapport à la valeur précédente
1 janv. 1983
1.133
+1.133
0.0%
1 janv. 1984
1.146
+0.013
1.14%
1 janv. 1986
1.162
+0.016
1.44%
1 janv. 1987
1.145
-0.017
-1.5%
1 janv. 1988
1.096
-0.048
-4.23%
1 janv. 1993
1.024
-0.072
-6.56%
1 janv. 1994
1.017
-0.008
-0.76%
1 janv. 1996
1.0
-0.017
-1.67%
1 janv. 1998
1.249
+0.249
24.93%
1 janv. 2000
0.986
-0.263
-21.06%
1 janv. 2003
1.04
+0.055
5.54%
1 janv. 2005
0.99
-0.051
-4.86%
1 janv. 2006
0.996
+0.006
0.65%
1 janv. 2007
1.002
+0.006
0.56%
1 janv. 2008
1.028
+0.026
2.61%
1 janv. 2009
1.017
-0.011
-1.08%
1 janv. 2010
1.021
+0.004
0.42%
1 janv. 2011
1.054
+0.033
3.19%

Classement des pays selon les statistiques actuelles par années