33
/fr/
AIzaSyB4mHJ5NPEv-XzF7P6NDYXjlkCWaeKw5bc
November 1, 2025
224285
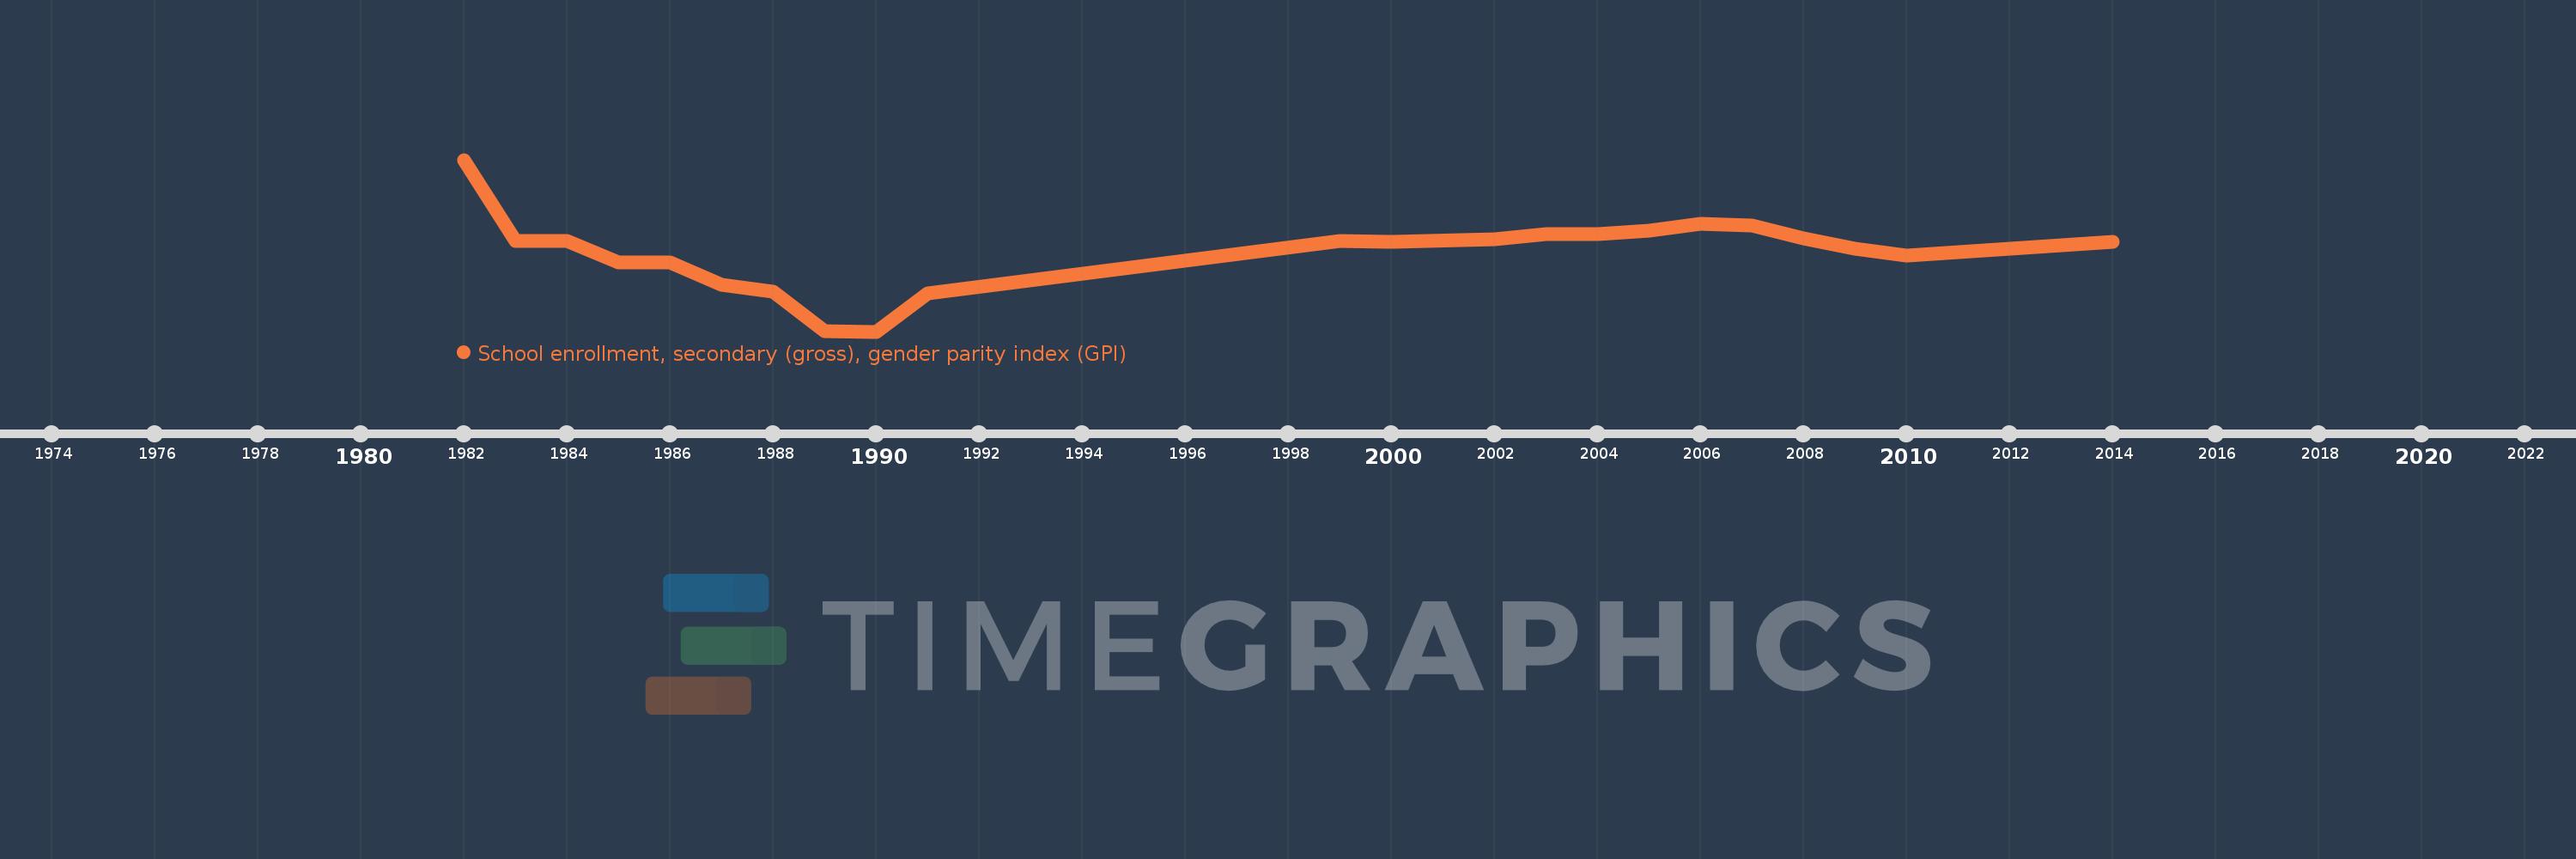
Philippines
PHL
true
2
1
School enrollment, secondary (gross), gender parity index (GPI)
2014,2010,2009,2008,2007,2006,2005,2004,2003,2002,2000,1999,1991,1990,1989,1988,1987,1986,1985,1984,1983,1982