33
/fr/
AIzaSyB4mHJ5NPEv-XzF7P6NDYXjlkCWaeKw5bc
November 30, 2025
272942
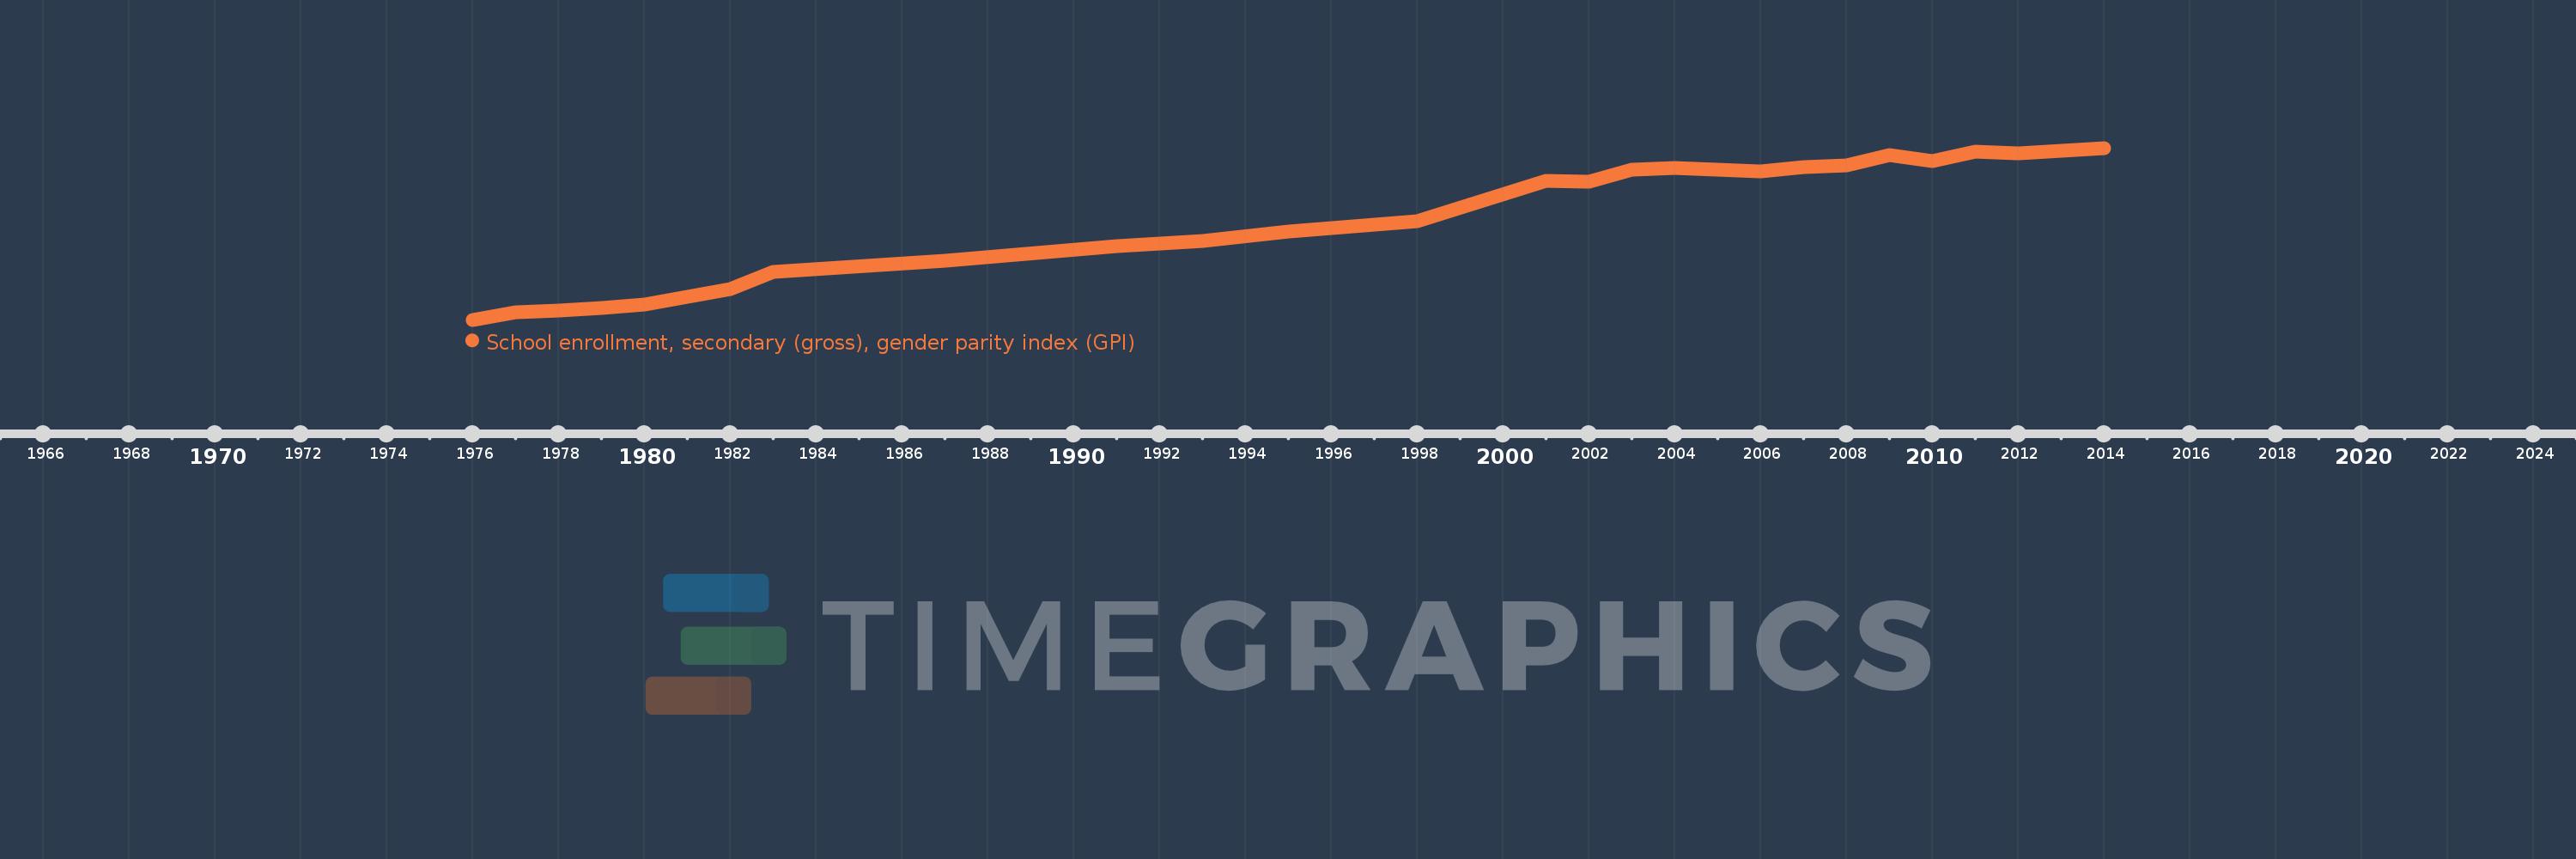
Uganda
UGA
true
2
1
School enrollment, secondary (gross), gender parity index (GPI)
2014,2012,2011,2010,2009,2008,2007,2006,2005,2004,2003,2002,2001,1998,1995,1993,1991,1987,1983,1982,1980,1979,1978,1977,1976