33
/fr/
AIzaSyB4mHJ5NPEv-XzF7P6NDYXjlkCWaeKw5bc
November 30, 2025
103036
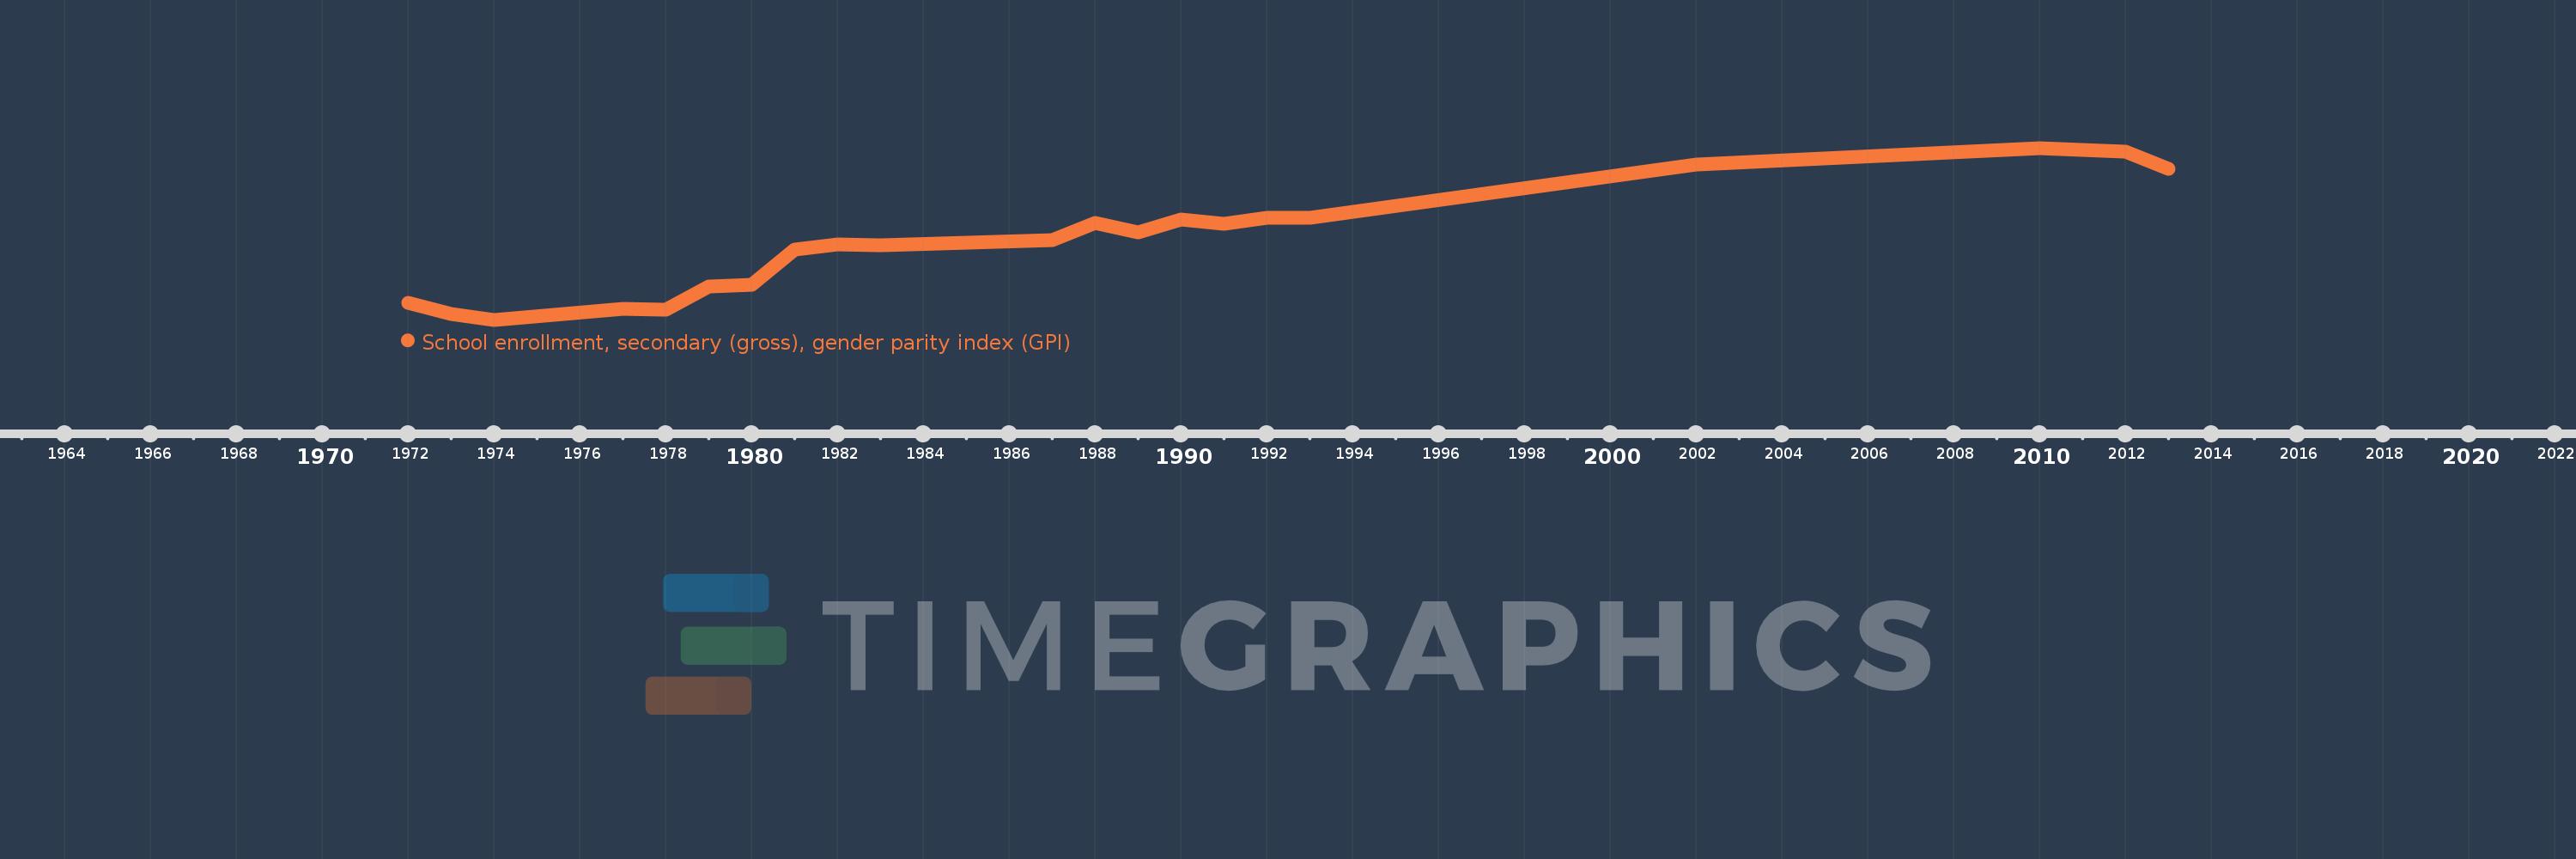
Central African Republic
CAF
true
2
1
School enrollment, secondary (gross), gender parity index (GPI)
2013,2012,2010,2002,1993,1992,1991,1990,1989,1988,1987,1983,1982,1981,1980,1979,1978,1977,1974,1973,1972