33
/fr/
AIzaSyAYiBZKx7MnpbEhh9jyipgxe19OcubqV5w
August 1, 2025
75373
Azerbaijan
AZE
true
2
1
Net financial flows, IDA (NFL, current US$)
2016,2015,2014,2013,2012,2011,2010,2009,2008,2007,2006,2005,2004,2003,2002,2001,2000,1999,1998,1997,1996
Download
Bibliothèque de statistiques globales →Azerbaijan →

Net financial flows, IDA (NFL, current US$)

Cette statistique dans les autres pays:

AfghanistanAlbaniaAngolaArmeniaAzerbaijanBangladeshBeninBhutanBoliviaBosnia and HerzegovinaBotswanaBurkina FasoBurundiCabo VerdeCambodiaCameroonCaribbean small statesCentral African RepublicCentral Europe and the BalticsChadChinaColombiaComorosCongo, Dem. Rep.Congo, Rep.Costa RicaCote d'IvoireCroatiaCzech RepublicDjiboutiDominicaDominican RepublicEarly-demographic dividendEast Asia & PacificEast Asia & Pacific (excluding high income)East Asia & Pacific (IDA & IBRD countries)EcuadorEgypt, Arab Rep.El SalvadorEquatorial GuineaEritreaEstoniaEthiopiaEurope & Central AsiaEurope & Central Asia (excluding high income)Europe & Central Asia (IDA & IBRD countries)Fragile and conflict affected situationsGambia, TheGeorgiaGhanaGreeceGrenadaGuineaGuinea-BissauGuyanaHaitiHondurasHungaryIBRD onlyIDA & IBRD totalIDA blendIDA onlyIDA totalIndiaIndonesiaJordanKenyaKorea, Rep.KosovoKyrgyz RepublicLao PDRLate-demographic dividendLatin America & Caribbean Latin America & Caribbean (excluding high income)Latin America & the Caribbean (IDA & IBRD countries)LesothoLiberiaLow & middle incomeLow incomeLower middle incomeMacedonia, FYRMadagascarMalawiMaldivesMaliMauritaniaMauritiusMiddle East & North AfricaMiddle East & North Africa (excluding high income)Middle East & North Africa (IDA & IBRD countries)Middle incomeMoldovaMongoliaMontenegroMoroccoMozambiqueMyanmarNepalNicaraguaNigerNigeriaOmanOther small statesPacific island small statesPakistanPapua New GuineaParaguayPhilippinesPolandPre-demographic dividendRwandaSamoaSao Tome and PrincipeSenegalSerbiaSeychellesSierra LeoneSlovak RepublicSloveniaSmall statesSolomon IslandsSomaliaSouth AsiaSouth Asia (IDA & IBRD)Sri LankaSt. Kitts and NevisSt. LuciaSt. Vincent and the GrenadinesSub-Saharan Africa Sub-Saharan Africa (excluding high income)Sub-Saharan Africa (IDA & IBRD countries)SudanSwazilandSyrian Arab RepublicTajikistanTanzaniaThailandTogoTongaTrinidad and TobagoTunisiaTurkeyUgandaUpper middle incomeUzbekistanVanuatuVietnamYemen, Rep.ZambiaZimbabwe

La ligne de temps

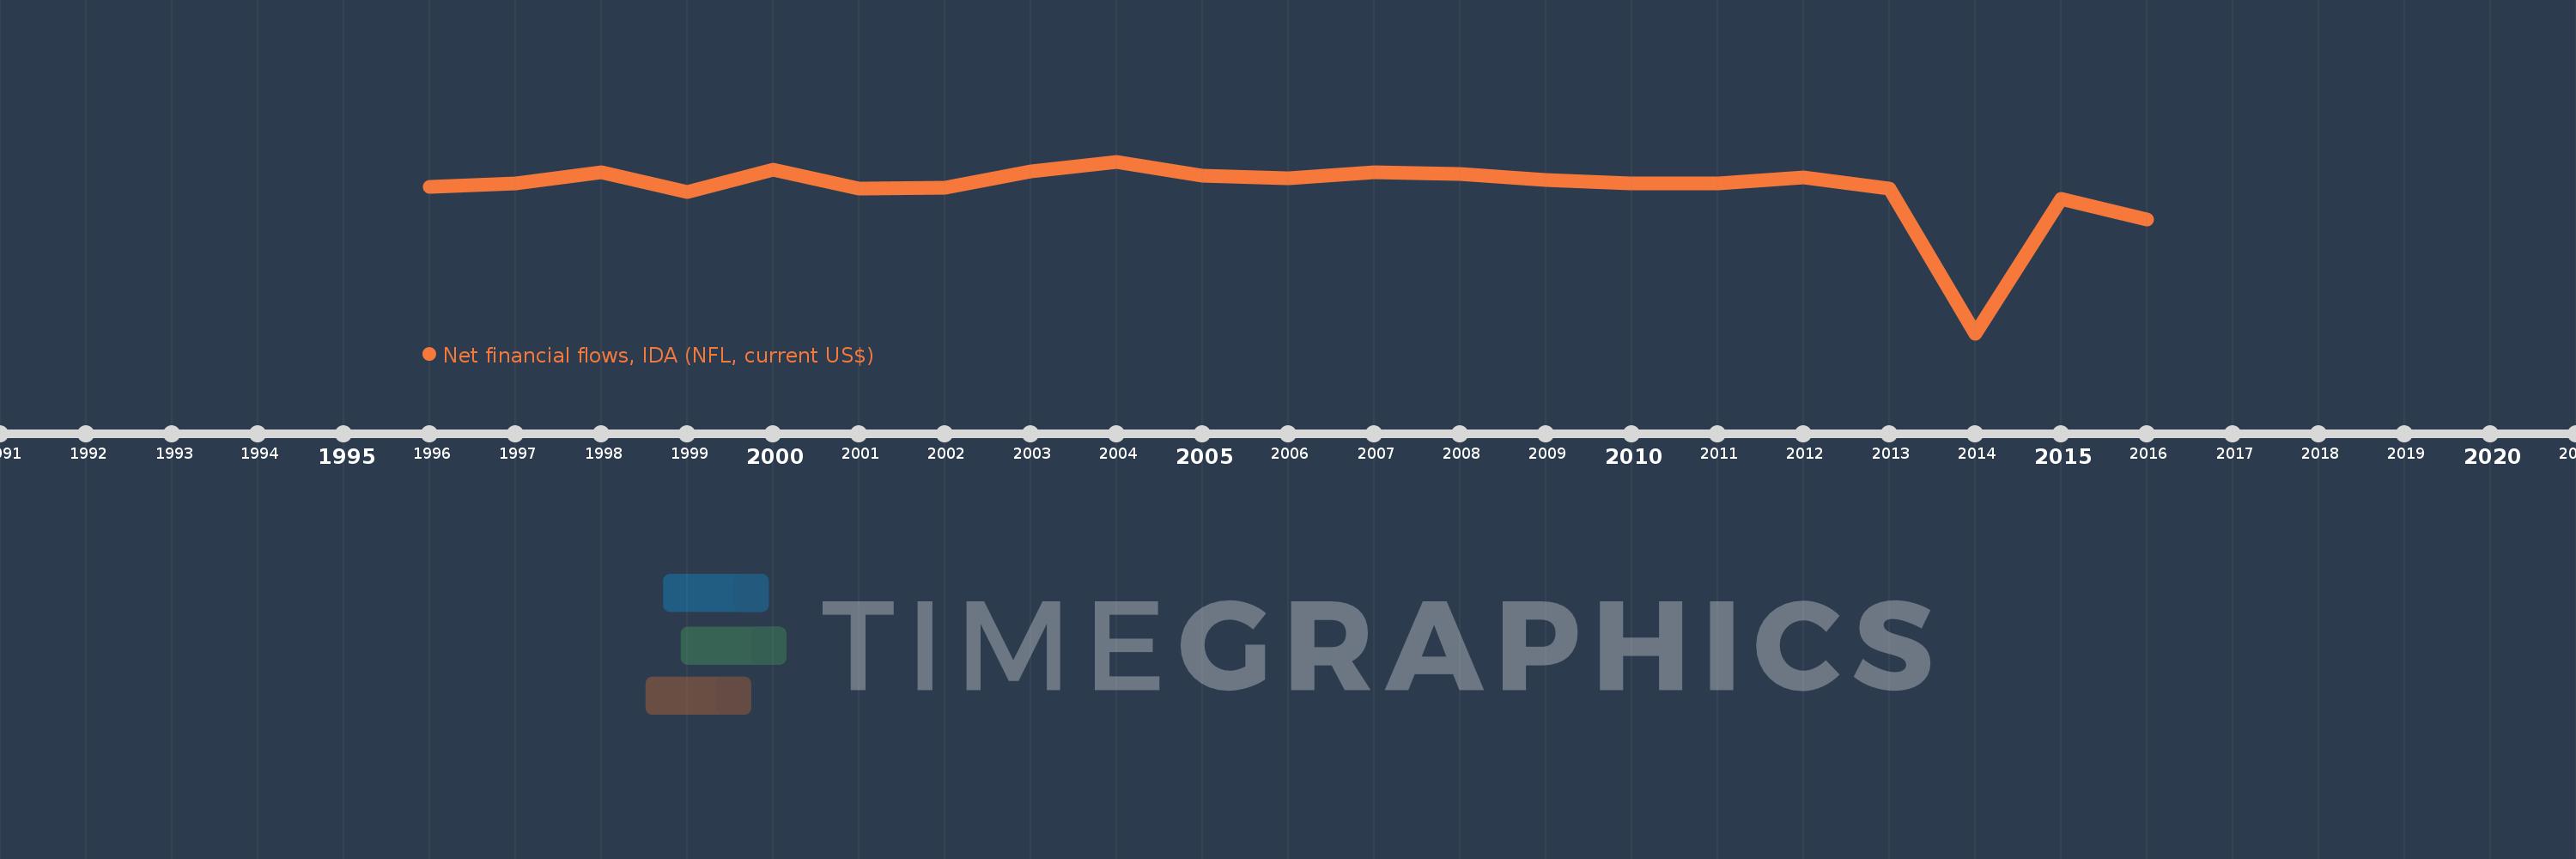
Cette échelle de temps montre un graphique de 1996 année à 2016 année Azerbaijan. Les données jusqu'à 1995 année ne sont pas présentés. Quantité d'observations actuelles selon dates: 21.

Source (désignation):

Les indicateurs du développement mondiale

Source (organisation):

World Bank, International Debt Statistics.

Catégories:

External Debt

Dernière mise à jour

23 avr. 2017

Les indicateurs de changement de valeurs selon les années

En moyenne:
25.097 mln.
Minimum:
-231.522 mln.
1 janv. 2014
Maximum:
74.742 mln.
1 janv. 2004
Pour la date d''observation
Valeur
Changement absolu
Le changement par rapport à la valeur précédente
1 janv. 1996
30.204 mln.
+30.204 mln.
0.0%
1 janv. 1997
35.84 mln.
+5.636 mln.
18.66%
1 janv. 1998
55.352 mln.
+19.512 mln.
54.44%
1 janv. 1999
20.635 mln.
-34.717 mln.
-62.72%
1 janv. 2000
60.496 mln.
+39.861 mln.
193.17%
1 janv. 2001
27.196 mln.
-33.3 mln.
-55.04%
1 janv. 2002
27.557 mln.
+361.0 milles
1.33%
1 janv. 2003
56.919 mln.
+29.362 mln.
106.55%
1 janv. 2004
74.742 mln.
+17.823 mln.
31.31%
1 janv. 2005
49.165 mln.
-25.577 mln.
-34.22%
1 janv. 2006
45.634 mln.
-3.531 mln.
-7.18%
1 janv. 2007
56.313 mln.
+10.679 mln.
23.4%
1 janv. 2008
51.982 mln.
-4.331 mln.
-7.69%
1 janv. 2009
42.157 mln.
-9.825 mln.
-18.9%
1 janv. 2010
36.081 mln.
-6.076 mln.
-14.41%
1 janv. 2011
35.925 mln.
-156.0 milles
-0.43%
1 janv. 2012
46.739 mln.
+10.814 mln.
30.1%
1 janv. 2013
26.451 mln.
-20.288 mln.
-43.41%
1 janv. 2014
-231.522 mln.
-257.973 mln.
-975.29%
1 janv. 2015
8.36 mln.
+239.882 mln.
-103.61%
1 janv. 2016
-29.184 mln.
-37.544 mln.
-449.09%

Classement des pays selon les statistiques actuelles par années