29
/fr/
fr
AIzaSyAYiBZKx7MnpbEhh9jyipgxe19OcubqV5w
April 1, 2024
197928
Moldova
MDA
true
2
1
Net financial flows, IDA (NFL, current US$)
2016,2015,2014,2013,2012,2011,2010,2009,2008,2007,2006,2005,2004,2003,2002,2001,2000,1999,1998
Download
Bibliothèque de statistiques globales →Moldova →

Net financial flows, IDA (NFL, current US$)

Cette statistique dans les autres pays:
AfghanistanAlbaniaAngolaArmeniaAzerbaijanBangladeshBeninBhutanBoliviaBosnia and HerzegovinaBotswanaBurkina FasoBurundiCabo VerdeCambodiaCameroonCaribbean small statesCentral African RepublicCentral Europe and the BalticsChadChinaColombiaComorosCongo, Dem. Rep.Congo, Rep.Costa RicaCote d'IvoireCroatiaCzech RepublicDjiboutiDominicaDominican RepublicEarly-demographic dividendEast Asia & PacificEast Asia & Pacific (excluding high income)East Asia & Pacific (IDA & IBRD countries)EcuadorEgypt, Arab Rep.El SalvadorEquatorial GuineaEritreaEstoniaEthiopiaEurope & Central AsiaEurope & Central Asia (excluding high income)Europe & Central Asia (IDA & IBRD countries)Fragile and conflict affected situationsGambia, TheGeorgiaGhanaGreeceGrenadaGuineaGuinea-BissauGuyanaHaitiHondurasHungaryIBRD onlyIDA & IBRD totalIDA blendIDA onlyIDA totalIndiaIndonesiaJordanKenyaKorea, Rep.KosovoKyrgyz RepublicLao PDRLate-demographic dividendLatin America & Caribbean Latin America & Caribbean (excluding high income)Latin America & the Caribbean (IDA & IBRD countries)LesothoLiberiaLow & middle incomeLow incomeLower middle incomeMacedonia, FYRMadagascarMalawiMaldivesMaliMauritaniaMauritiusMiddle East & North AfricaMiddle East & North Africa (excluding high income)Middle East & North Africa (IDA & IBRD countries)Middle incomeMoldovaMongoliaMontenegroMoroccoMozambiqueMyanmarNepalNicaraguaNigerNigeriaOmanOther small statesPacific island small statesPakistanPapua New GuineaParaguayPhilippinesPolandPre-demographic dividendRwandaSamoaSao Tome and PrincipeSenegalSerbiaSeychellesSierra LeoneSlovak RepublicSloveniaSmall statesSolomon IslandsSomaliaSouth AsiaSouth Asia (IDA & IBRD)Sri LankaSt. Kitts and NevisSt. LuciaSt. Vincent and the GrenadinesSub-Saharan Africa Sub-Saharan Africa (excluding high income)Sub-Saharan Africa (IDA & IBRD countries)SudanSwazilandSyrian Arab RepublicTajikistanTanzaniaThailandTogoTongaTrinidad and TobagoTunisiaTurkeyUgandaUpper middle incomeUzbekistanVanuatuVietnamYemen, Rep.ZambiaZimbabwe
La ligne de temps
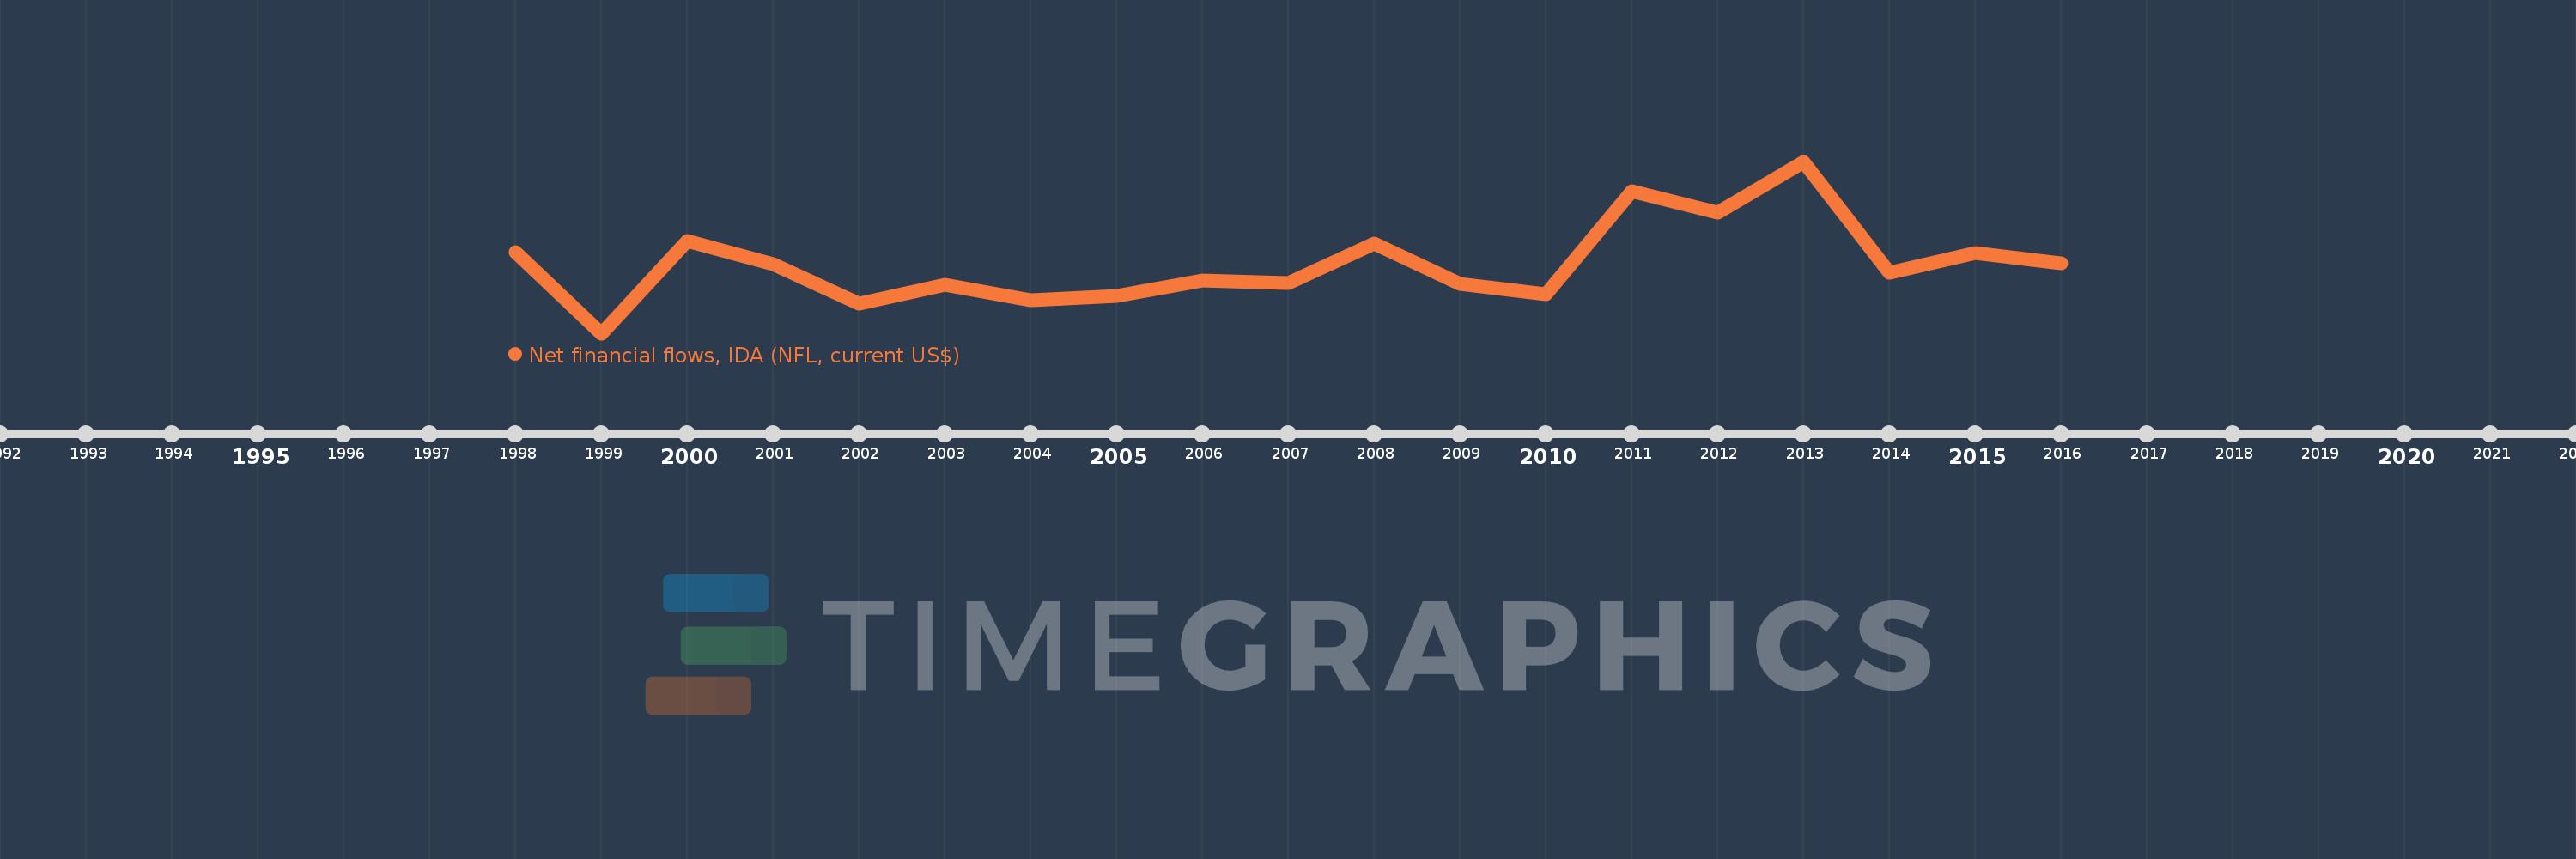
Cette échelle de temps montre un graphique de 1998 année à 2016 année Moldova. Les données jusqu'à 1997 année ne sont pas présentés. Quantité d'observations actuelles selon dates: 19.
Source (désignation):
Les indicateurs du développement mondiale
Source (organisation):
World Bank, International Debt Statistics.
Catégories:
External Debt
Dernière mise à jour
23 avr. 2017
Les indicateurs de changement de valeurs selon les années
En moyenne:
30.145 mln.
Minimum:
2.258 mln.
1 janv. 1999
Maximum:
71.252 mln.
1 janv. 2013
Pour la date d''observation
Valeur
Changement absolu
Le changement par rapport à la valeur précédente
1 janv. 1998
35.0 mln.
+35.0 mln.
0.0%
1 janv. 1999
2.258 mln.
-32.742 mln.
-93.55%
1 janv. 2000
39.27 mln.
+37.012 mln.
1.64 milles%
1 janv. 2001
30.083 mln.
-9.187 mln.
-23.39%
1 janv. 2002
14.156 mln.
-15.927 mln.
-52.94%
1 janv. 2003
21.87 mln.
+7.714 mln.
54.49%
1 janv. 2004
15.654 mln.
-6.216 mln.
-28.42%
1 janv. 2005
17.237 mln.
+1.583 mln.
10.11%
1 janv. 2006
23.563 mln.
+6.326 mln.
36.7%
1 janv. 2007
22.568 mln.
-995.0 milles
-4.22%
1 janv. 2008
38.153 mln.
+15.585 mln.
69.06%
1 janv. 2009
22.19 mln.
-15.963 mln.
-41.84%
1 janv. 2010
17.985 mln.
-4.205 mln.
-18.95%
1 janv. 2011
59.366 mln.
+41.381 mln.
230.09%
1 janv. 2012
50.718 mln.
-8.648 mln.
-14.57%
1 janv. 2013
71.252 mln.
+20.534 mln.
40.49%
1 janv. 2014
26.661 mln.
-44.591 mln.
-62.58%
1 janv. 2015
34.56 mln.
+7.899 mln.
29.63%
1 janv. 2016
30.215 mln.
-4.345 mln.
-12.57%
Classement des pays selon les statistiques actuelles par années

Commentaires:

Envoyer
PremiumAbout & FeedbackUn accordConfidentialité
logo
© 2022 Selected Technologies LLC – Morgan Hill, California