29
/fr/
fr
AIzaSyAYiBZKx7MnpbEhh9jyipgxe19OcubqV5w
April 1, 2024
200720
Montenegro
MNE
true
2
1
Net financial flows, IDA (NFL, current US$)
2016,2015,2014,2013,2012,2011,2010,2009,2008,2007
Download
Bibliothèque de statistiques globales →Montenegro →

Net financial flows, IDA (NFL, current US$)

Cette statistique dans les autres pays:
AfghanistanAlbaniaAngolaArmeniaAzerbaijanBangladeshBeninBhutanBoliviaBosnia and HerzegovinaBotswanaBurkina FasoBurundiCabo VerdeCambodiaCameroonCaribbean small statesCentral African RepublicCentral Europe and the BalticsChadChinaColombiaComorosCongo, Dem. Rep.Congo, Rep.Costa RicaCote d'IvoireCroatiaCzech RepublicDjiboutiDominicaDominican RepublicEarly-demographic dividendEast Asia & PacificEast Asia & Pacific (excluding high income)East Asia & Pacific (IDA & IBRD countries)EcuadorEgypt, Arab Rep.El SalvadorEquatorial GuineaEritreaEstoniaEthiopiaEurope & Central AsiaEurope & Central Asia (excluding high income)Europe & Central Asia (IDA & IBRD countries)Fragile and conflict affected situationsGambia, TheGeorgiaGhanaGreeceGrenadaGuineaGuinea-BissauGuyanaHaitiHondurasHungaryIBRD onlyIDA & IBRD totalIDA blendIDA onlyIDA totalIndiaIndonesiaJordanKenyaKorea, Rep.KosovoKyrgyz RepublicLao PDRLate-demographic dividendLatin America & Caribbean Latin America & Caribbean (excluding high income)Latin America & the Caribbean (IDA & IBRD countries)LesothoLiberiaLow & middle incomeLow incomeLower middle incomeMacedonia, FYRMadagascarMalawiMaldivesMaliMauritaniaMauritiusMiddle East & North AfricaMiddle East & North Africa (excluding high income)Middle East & North Africa (IDA & IBRD countries)Middle incomeMoldovaMongoliaMontenegroMoroccoMozambiqueMyanmarNepalNicaraguaNigerNigeriaOmanOther small statesPacific island small statesPakistanPapua New GuineaParaguayPhilippinesPolandPre-demographic dividendRwandaSamoaSao Tome and PrincipeSenegalSerbiaSeychellesSierra LeoneSlovak RepublicSloveniaSmall statesSolomon IslandsSomaliaSouth AsiaSouth Asia (IDA & IBRD)Sri LankaSt. Kitts and NevisSt. LuciaSt. Vincent and the GrenadinesSub-Saharan Africa Sub-Saharan Africa (excluding high income)Sub-Saharan Africa (IDA & IBRD countries)SudanSwazilandSyrian Arab RepublicTajikistanTanzaniaThailandTogoTongaTrinidad and TobagoTunisiaTurkeyUgandaUpper middle incomeUzbekistanVanuatuVietnamYemen, Rep.ZambiaZimbabwe
La ligne de temps
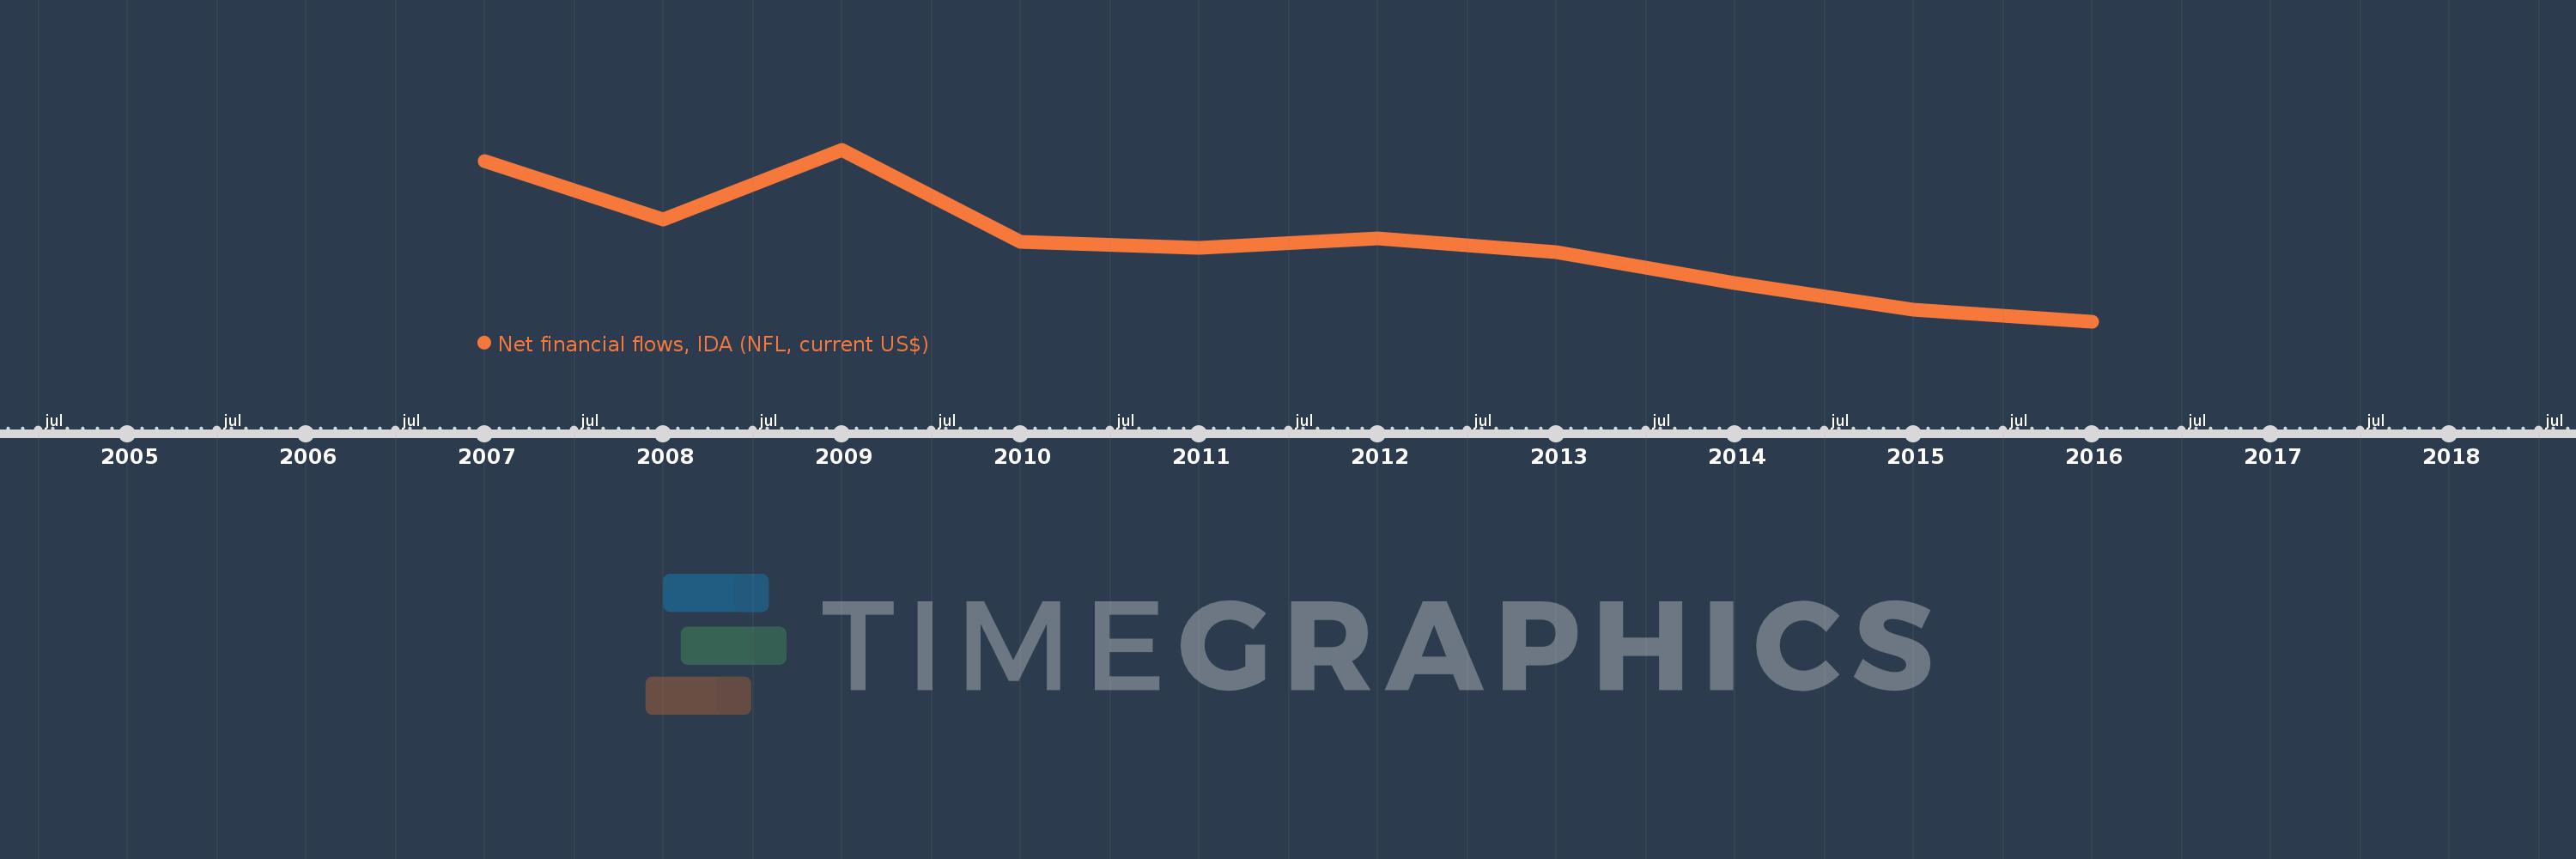
Cette échelle de temps montre un graphique de 2007 année à 2016 année Montenegro. Les données jusqu'à 2006 année ne sont pas présentés. Quantité d'observations actuelles selon dates: 10.
Source (désignation):
Les indicateurs du développement mondiale
Source (organisation):
World Bank, International Debt Statistics.
Catégories:
External Debt
Dernière mise à jour
23 avr. 2017
Les indicateurs de changement de valeurs selon les années
En moyenne:
3.683 mln.
Minimum:
-6.398 mln.
1 janv. 2016
Maximum:
15.418 mln.
1 janv. 2009
Pour la date d''observation
Valeur
Changement absolu
Le changement par rapport à la valeur précédente
1 janv. 2007
14.006 mln.
+14.006 mln.
0.0%
1 janv. 2008
6.6 mln.
-7.406 mln.
-52.88%
1 janv. 2009
15.418 mln.
+8.818 mln.
133.61%
1 janv. 2010
3.796 mln.
-11.622 mln.
-75.38%
1 janv. 2011
3.032 mln.
-764.0 milles
-20.13%
1 janv. 2012
4.241 mln.
+1.209 mln.
39.87%
1 janv. 2013
2.51 mln.
-1.731 mln.
-40.82%
1 janv. 2014
-1.509 mln.
-4.019 mln.
-160.12%
1 janv. 2015
-4.867 mln.
-3.358 mln.
222.53%
1 janv. 2016
-6.398 mln.
-1.531 mln.
31.46%
Classement des pays selon les statistiques actuelles par années

Commentaires:

Envoyer
PremiumAbout & FeedbackUn accordConfidentialité
logo
© 2022 Selected Technologies LLC – Morgan Hill, California