33
/fr/
AIzaSyAYiBZKx7MnpbEhh9jyipgxe19OcubqV5w
May 1, 2025
138396
Georgia
GEO
true
2
1
Net financial flows, IDA (NFL, current US$)
2016,2015,2014,2013,2012,2011,2010,2009,2008,2007,2006,2005,2004,2003,2002,2001,2000,1999,1998,1997,1996,1995
Download
Bibliothèque de statistiques globales →Georgia →

Net financial flows, IDA (NFL, current US$)

Cette statistique dans les autres pays:

AfghanistanAlbaniaAngolaArmeniaAzerbaijanBangladeshBeninBhutanBoliviaBosnia and HerzegovinaBotswanaBurkina FasoBurundiCabo VerdeCambodiaCameroonCaribbean small statesCentral African RepublicCentral Europe and the BalticsChadChinaColombiaComorosCongo, Dem. Rep.Congo, Rep.Costa RicaCote d'IvoireCroatiaCzech RepublicDjiboutiDominicaDominican RepublicEarly-demographic dividendEast Asia & PacificEast Asia & Pacific (excluding high income)East Asia & Pacific (IDA & IBRD countries)EcuadorEgypt, Arab Rep.El SalvadorEquatorial GuineaEritreaEstoniaEthiopiaEurope & Central AsiaEurope & Central Asia (excluding high income)Europe & Central Asia (IDA & IBRD countries)Fragile and conflict affected situationsGambia, TheGeorgiaGhanaGreeceGrenadaGuineaGuinea-BissauGuyanaHaitiHondurasHungaryIBRD onlyIDA & IBRD totalIDA blendIDA onlyIDA totalIndiaIndonesiaJordanKenyaKorea, Rep.KosovoKyrgyz RepublicLao PDRLate-demographic dividendLatin America & Caribbean Latin America & Caribbean (excluding high income)Latin America & the Caribbean (IDA & IBRD countries)LesothoLiberiaLow & middle incomeLow incomeLower middle incomeMacedonia, FYRMadagascarMalawiMaldivesMaliMauritaniaMauritiusMiddle East & North AfricaMiddle East & North Africa (excluding high income)Middle East & North Africa (IDA & IBRD countries)Middle incomeMoldovaMongoliaMontenegroMoroccoMozambiqueMyanmarNepalNicaraguaNigerNigeriaOmanOther small statesPacific island small statesPakistanPapua New GuineaParaguayPhilippinesPolandPre-demographic dividendRwandaSamoaSao Tome and PrincipeSenegalSerbiaSeychellesSierra LeoneSlovak RepublicSloveniaSmall statesSolomon IslandsSomaliaSouth AsiaSouth Asia (IDA & IBRD)Sri LankaSt. Kitts and NevisSt. LuciaSt. Vincent and the GrenadinesSub-Saharan Africa Sub-Saharan Africa (excluding high income)Sub-Saharan Africa (IDA & IBRD countries)SudanSwazilandSyrian Arab RepublicTajikistanTanzaniaThailandTogoTongaTrinidad and TobagoTunisiaTurkeyUgandaUpper middle incomeUzbekistanVanuatuVietnamYemen, Rep.ZambiaZimbabwe

La ligne de temps

Cette échelle de temps montre un graphique de 1995 année à 2016 année Georgia. Les données jusqu'à 1994 année ne sont pas présentés. Quantité d'observations actuelles selon dates: 22.

Source (désignation):

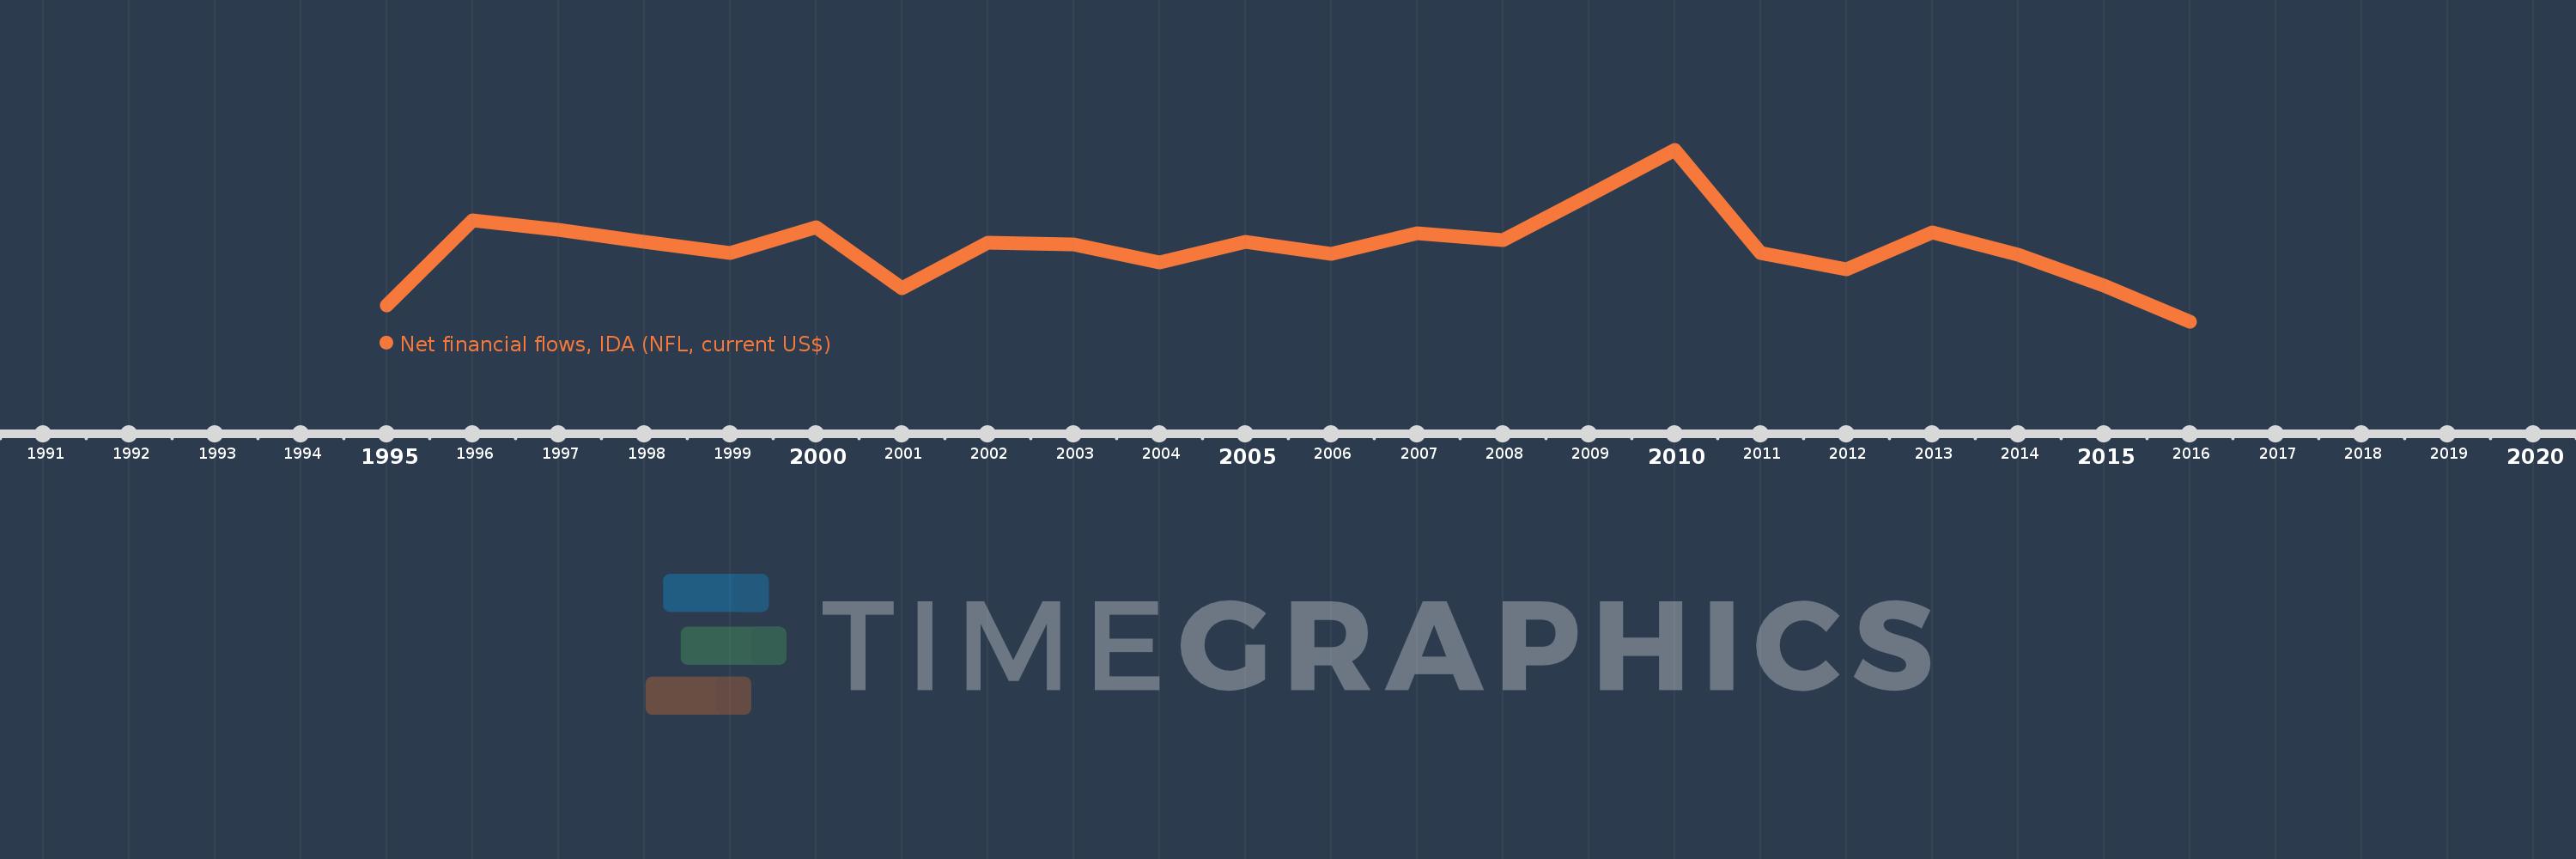
Les indicateurs du développement mondiale

Source (organisation):

World Bank, International Debt Statistics.

Catégories:

External Debt

Dernière mise à jour

23 avr. 2017

Les indicateurs de changement de valeurs selon les années

En moyenne:
58.315 mln.
Minimum:
-15.731 mln.
1 janv. 2016
Maximum:
155.161 mln.
1 janv. 2010
Pour la date d''observation
Valeur
Changement absolu
Le changement par rapport à la valeur précédente
1 janv. 1995
971.0 milles
+971.0 milles
0.0%
1 janv. 1996
85.059 mln.
+84.088 mln.
8.66 milles%
1 janv. 1997
76.337 mln.
-8.722 mln.
-10.25%
1 janv. 1998
64.25 mln.
-12.087 mln.
-15.83%
1 janv. 1999
52.902 mln.
-11.348 mln.
-17.66%
1 janv. 2000
78.839 mln.
+25.937 mln.
49.03%
1 janv. 2001
18.103 mln.
-60.736 mln.
-77.04%
1 janv. 2002
63.109 mln.
+45.006 mln.
248.61%
1 janv. 2003
61.333 mln.
-1.776 mln.
-2.81%
1 janv. 2004
43.462 mln.
-17.871 mln.
-29.14%
1 janv. 2005
64.381 mln.
+20.919 mln.
48.13%
1 janv. 2006
52.092 mln.
-12.289 mln.
-19.09%
1 janv. 2007
72.344 mln.
+20.252 mln.
38.88%
1 janv. 2008
65.396 mln.
-6.948 mln.
-9.6%
1 janv. 2009
110.225 mln.
+44.829 mln.
68.55%
1 janv. 2010
155.161 mln.
+44.936 mln.
40.77%
1 janv. 2011
52.878 mln.
-102.283 mln.
-65.92%
1 janv. 2012
36.645 mln.
-16.233 mln.
-30.7%
1 janv. 2013
73.403 mln.
+36.758 mln.
100.31%
1 janv. 2014
51.489 mln.
-21.914 mln.
-29.85%
1 janv. 2015
20.29 mln.
-31.199 mln.
-60.59%
1 janv. 2016
-15.731 mln.
-36.021 mln.
-177.53%

Classement des pays selon les statistiques actuelles par années