33
/fr/
AIzaSyAYiBZKx7MnpbEhh9jyipgxe19OcubqV5w
August 1, 2025
75063
Azerbaijan
AZE
true
2
1
Gross fixed capital formation, private sector (% of GDP)
2008,2007,2006,2005,2004,2003,2002,2001,2000,1999,1998,1997,1996,1995,1994
Download
Bibliothèque de statistiques globales →Azerbaijan →

Gross fixed capital formation, private sector (% of GDP)

Cette statistique dans les autres pays:

AlbaniaAlgeriaAngolaAntigua and BarbudaArmeniaAustraliaAzerbaijanBangladeshBarbadosBelarusBelizeBeninBhutanBoliviaBosnia and HerzegovinaBotswanaBrazilBulgariaBurkina FasoBurundiCabo VerdeCambodiaCameroonCaribbean small statesCentral African RepublicChadColombiaComorosCongo, Dem. Rep.Congo, Rep.Costa RicaCote d'IvoireCroatiaDjiboutiDominicaDominican RepublicEarly-demographic dividendEcuadorEgypt, Arab Rep.El SalvadorEquatorial GuineaEritreaEthiopiaEurope & Central Asia (excluding high income)Europe & Central Asia (IDA & IBRD countries)FijiGabonGambia, TheGeorgiaGhanaGrenadaGuatemalaGuineaGuinea-BissauGuyanaHaitiHeavily indebted poor countries (HIPC)HondurasHong Kong SAR, ChinaIDA onlyIndiaIran, Islamic Rep.IraqJamaicaJapanJordanKazakhstanKenyaKosovoKyrgyz RepublicLao PDRLatin America & Caribbean Latin America & Caribbean (excluding high income)Latin America & the Caribbean (IDA & IBRD countries)Least developed countries: UN classificationLebanonLesothoLiberiaLibyaLow incomeLower middle incomeMacedonia, FYRMadagascarMalawiMalaysiaMaliMauritaniaMauritiusMexicoMiddle East & North Africa (excluding high income)Middle East & North Africa (IDA & IBRD countries)MoldovaMongoliaMontenegroMozambiqueNamibiaNepalNicaraguaNigerNorth AmericaOmanPakistanPanamaPapua New GuineaParaguayPeruPhilippinesRomaniaRussian FederationRwandaSenegalSerbiaSeychellesSierra LeoneSouth AfricaSouth AsiaSouth Asia (IDA & IBRD)South SudanSri LankaSt. Kitts and NevisSt. LuciaSt. Vincent and the GrenadinesSub-Saharan Africa Sub-Saharan Africa (excluding high income)Sub-Saharan Africa (IDA & IBRD countries)SudanSurinameSwazilandSyrian Arab RepublicTajikistanTanzaniaThailandTimor-LesteTogoTrinidad and TobagoTunisiaTurkeyTurkmenistanUgandaUkraineUnited Arab EmiratesUnited StatesUruguayUzbekistanVenezuela, RBYemen, Rep.Zimbabwe

La ligne de temps

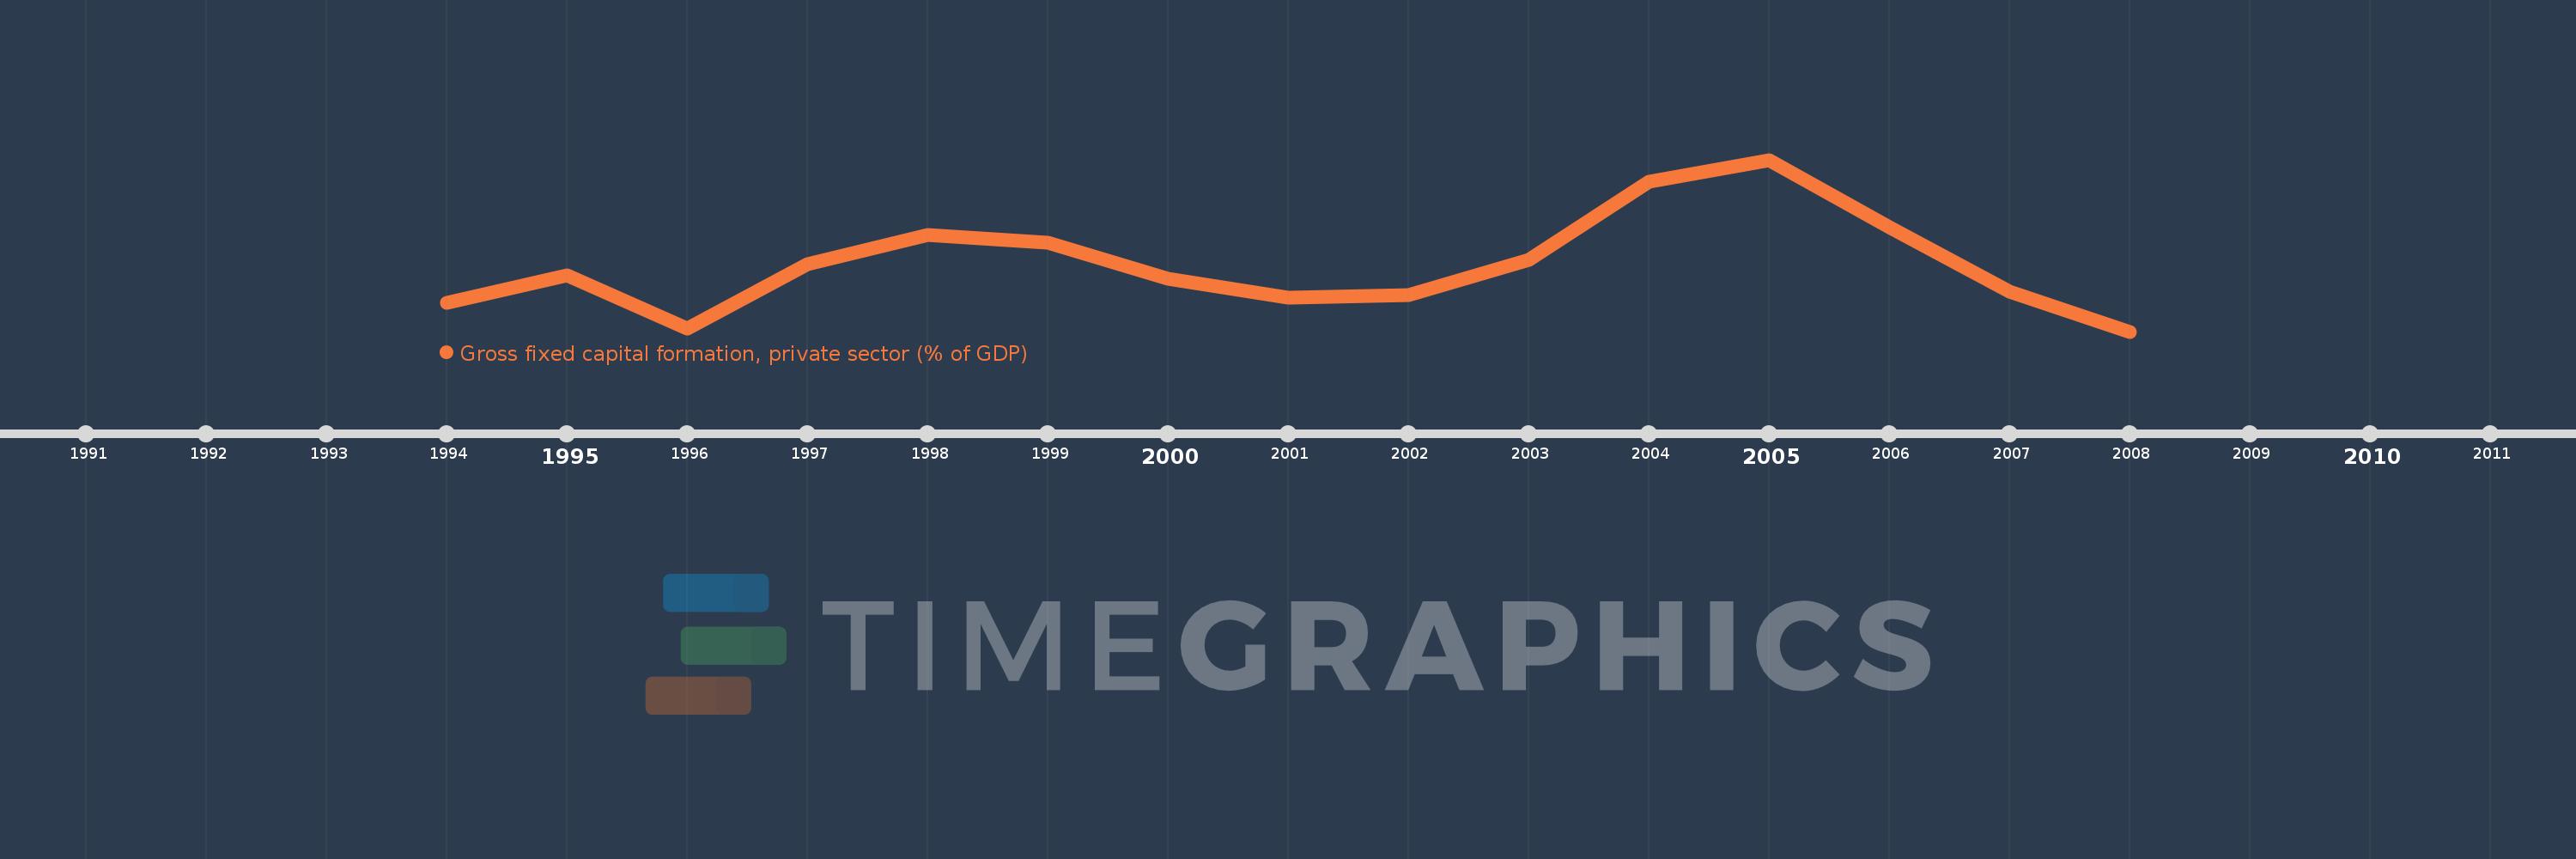
Cette échelle de temps montre un graphique de 1994 année à 2008 année Azerbaijan. Les données jusqu'à 1993 année ne sont pas présentés. Quantité d'observations actuelles selon dates: 15.

Source (désignation):

Les indicateurs du développement mondiale

Source (organisation):

World Bank national accounts data, and OECD National Accounts data files.

Catégories:

Economy & Growth

Dernière mise à jour

23 avr. 2017

Les indicateurs de changement de valeurs selon les années

En moyenne:
28.214
Minimum:
11.771
1 janv. 2008
Maximum:
54.065
1 janv. 2005
Pour la date d''observation
Valeur
Changement absolu
Le changement par rapport à la valeur précédente
1 janv. 1994
18.787
+18.787
0.0%
1 janv. 1995
25.659
+6.871
36.57%
1 janv. 1996
12.473
-13.186
-51.39%
1 janv. 1997
28.332
+15.859
127.15%
1 janv. 1998
35.597
+7.265
25.64%
1 janv. 1999
33.68
-1.917
-5.39%
1 janv. 2000
24.841
-8.839
-26.24%
1 janv. 2001
20.114
-4.727
-19.03%
1 janv. 2002
20.788
+0.674
3.35%
1 janv. 2003
29.442
+8.653
41.63%
1 janv. 2004
48.644
+19.203
65.22%
1 janv. 2005
54.065
+5.421
11.14%
1 janv. 2006
37.497
-16.568
-30.64%
1 janv. 2007
21.525
-15.973
-42.6%
1 janv. 2008
11.771
-9.754
-45.32%

Classement des pays selon les statistiques actuelles par années