33
/fr/
AIzaSyAYiBZKx7MnpbEhh9jyipgxe19OcubqV5w
August 1, 2025
163821
Japan
JPN
true
2
1
Gross fixed capital formation, private sector (% of GDP)
2016,2015,2014,2013,2012,2011,2010,2009,2008,2007,2006,2005,2004,2003,2002,2001,2000,1999,1998,1997,1996,1995
Download
Bibliothèque de statistiques globales →Japan →

Gross fixed capital formation, private sector (% of GDP)

Cette statistique dans les autres pays:

AlbaniaAlgeriaAngolaAntigua and BarbudaArmeniaAustraliaAzerbaijanBangladeshBarbadosBelarusBelizeBeninBhutanBoliviaBosnia and HerzegovinaBotswanaBrazilBulgariaBurkina FasoBurundiCabo VerdeCambodiaCameroonCaribbean small statesCentral African RepublicChadColombiaComorosCongo, Dem. Rep.Congo, Rep.Costa RicaCote d'IvoireCroatiaDjiboutiDominicaDominican RepublicEarly-demographic dividendEcuadorEgypt, Arab Rep.El SalvadorEquatorial GuineaEritreaEthiopiaEurope & Central Asia (excluding high income)Europe & Central Asia (IDA & IBRD countries)FijiGabonGambia, TheGeorgiaGhanaGrenadaGuatemalaGuineaGuinea-BissauGuyanaHaitiHeavily indebted poor countries (HIPC)HondurasHong Kong SAR, ChinaIDA onlyIndiaIran, Islamic Rep.IraqJamaicaJapanJordanKazakhstanKenyaKosovoKyrgyz RepublicLao PDRLatin America & Caribbean Latin America & Caribbean (excluding high income)Latin America & the Caribbean (IDA & IBRD countries)Least developed countries: UN classificationLebanonLesothoLiberiaLibyaLow incomeLower middle incomeMacedonia, FYRMadagascarMalawiMalaysiaMaliMauritaniaMauritiusMexicoMiddle East & North Africa (excluding high income)Middle East & North Africa (IDA & IBRD countries)MoldovaMongoliaMontenegroMozambiqueNamibiaNepalNicaraguaNigerNorth AmericaOmanPakistanPanamaPapua New GuineaParaguayPeruPhilippinesRomaniaRussian FederationRwandaSenegalSerbiaSeychellesSierra LeoneSouth AfricaSouth AsiaSouth Asia (IDA & IBRD)South SudanSri LankaSt. Kitts and NevisSt. LuciaSt. Vincent and the GrenadinesSub-Saharan Africa Sub-Saharan Africa (excluding high income)Sub-Saharan Africa (IDA & IBRD countries)SudanSurinameSwazilandSyrian Arab RepublicTajikistanTanzaniaThailandTimor-LesteTogoTrinidad and TobagoTunisiaTurkeyTurkmenistanUgandaUkraineUnited Arab EmiratesUnited StatesUruguayUzbekistanVenezuela, RBYemen, Rep.Zimbabwe

La ligne de temps

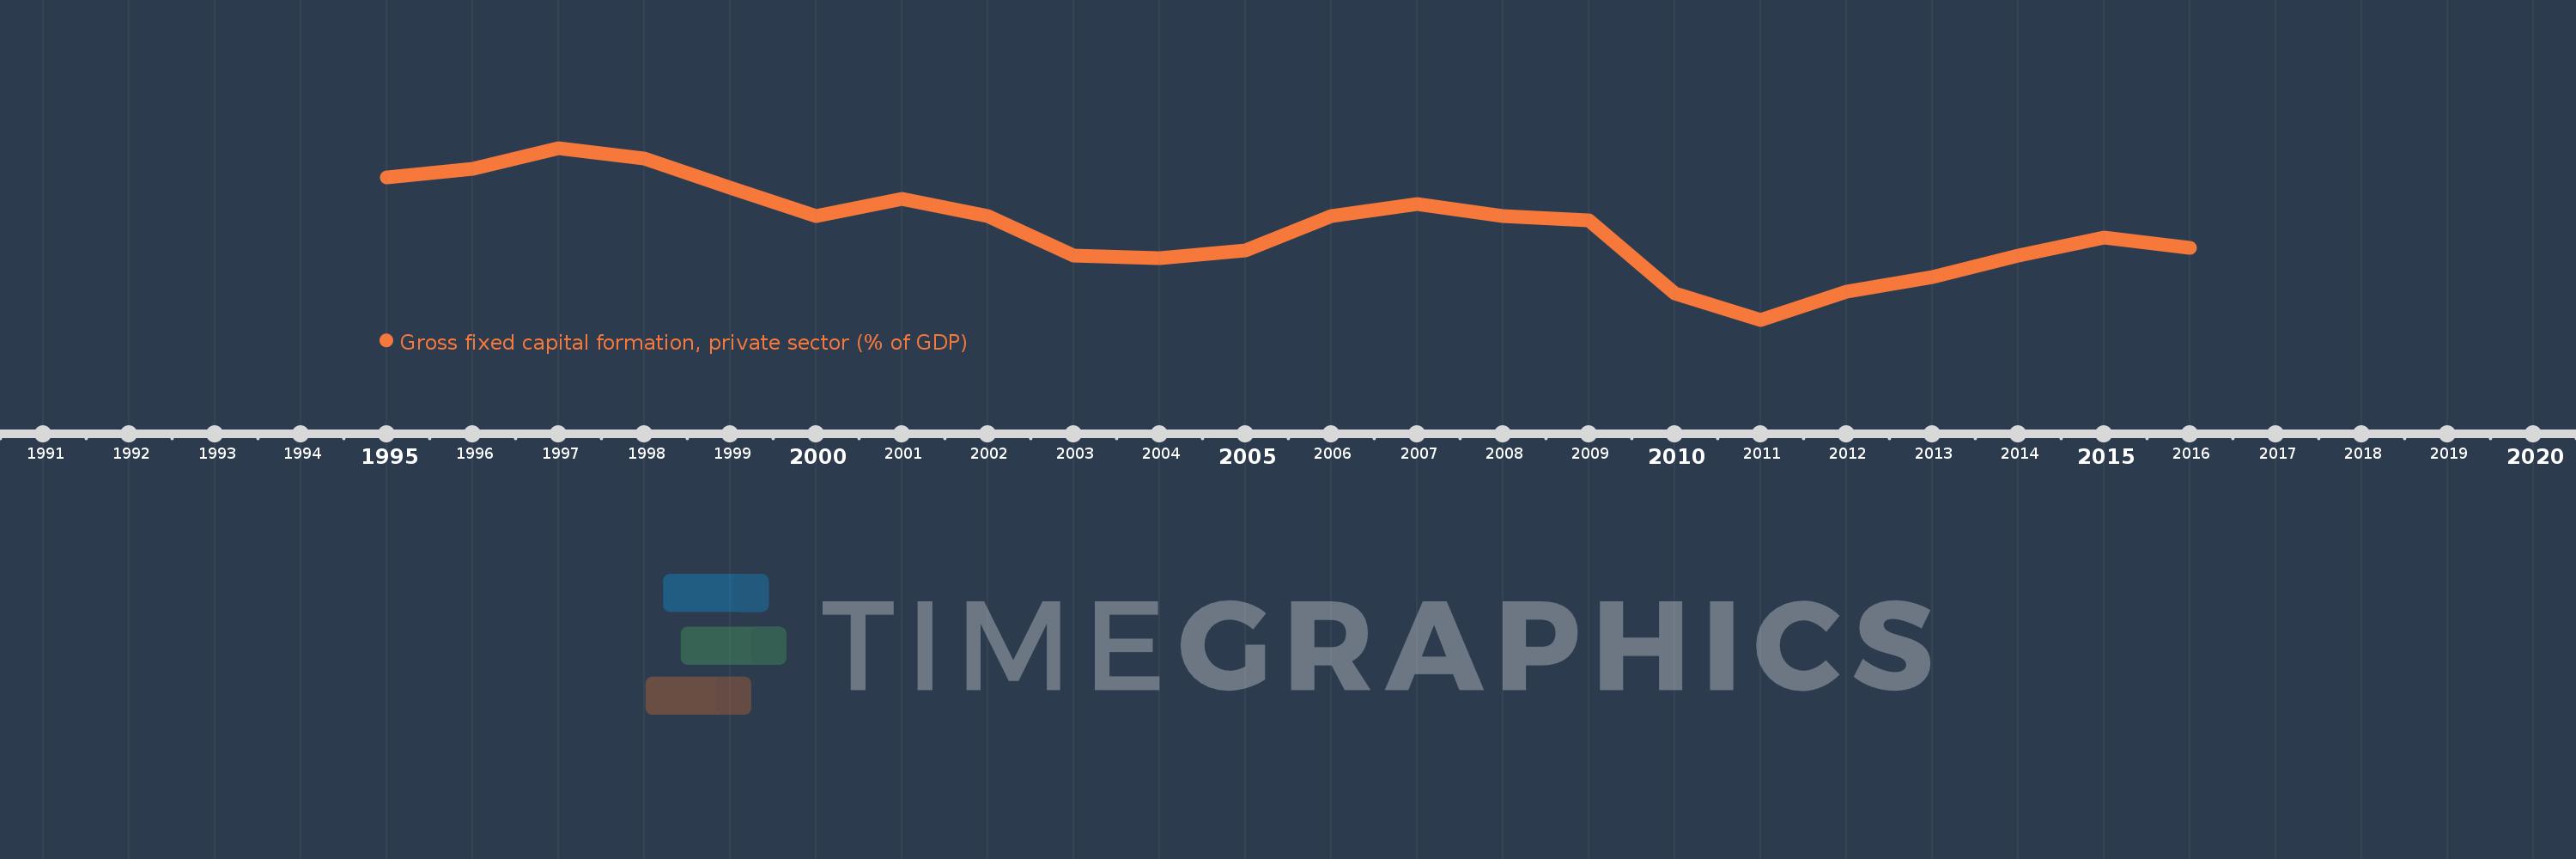
Cette échelle de temps montre un graphique de 1995 année à 2016 année Japan. Les données jusqu'à 1994 année ne sont pas présentés. Quantité d'observations actuelles selon dates: 22.

Source (désignation):

Les indicateurs du développement mondiale

Source (organisation):

World Bank national accounts data, and OECD National Accounts data files.

Catégories:

Economy & Growth

Dernière mise à jour

23 avr. 2017

Les indicateurs de changement de valeurs selon les années

En moyenne:
18.904
Minimum:
16.235
1 janv. 2011
Maximum:
21.231
1 janv. 1997
Pour la date d''observation
Valeur
Changement absolu
Le changement par rapport à la valeur précédente
1 janv. 1995
20.374
+20.374
0.0%
1 janv. 1996
20.612
+0.237
1.17%
1 janv. 1997
21.231
+0.619
3.0%
1 janv. 1998
20.918
-0.313
-1.48%
1 janv. 1999
20.081
-0.836
-4.0%
1 janv. 2000
19.248
-0.834
-4.15%
1 janv. 2001
19.754
+0.506
2.63%
1 janv. 2002
19.26
-0.494
-2.5%
1 janv. 2003
18.098
-1.162
-6.03%
1 janv. 2004
18.036
-0.062
-0.34%
1 janv. 2005
18.241
+0.205
1.14%
1 janv. 2006
19.255
+1.015
5.56%
1 janv. 2007
19.588
+0.333
1.73%
1 janv. 2008
19.249
-0.338
-1.73%
1 janv. 2009
19.116
-0.134
-0.69%
1 janv. 2010
17.005
-2.111
-11.04%
1 janv. 2011
16.235
-0.771
-4.53%
1 janv. 2012
17.042
+0.807
4.97%
1 janv. 2013
17.485
+0.443
2.6%
1 janv. 2014
18.094
+0.609
3.49%
1 janv. 2015
18.629
+0.534
2.95%
1 janv. 2016
18.334
-0.294
-1.58%

Classement des pays selon les statistiques actuelles par années