33
/fr/
AIzaSyAYiBZKx7MnpbEhh9jyipgxe19OcubqV5w
August 1, 2025
149192
Haiti
HTI
true
2
1
Gross fixed capital formation, private sector (% of GDP)
2016,2015,2014,2013,2012,2011,2010,2009,2008,2007,2006,2005,2004,2003,2002,2001,2000,1999,1998,1997
Download
Bibliothèque de statistiques globales →Haiti →

Gross fixed capital formation, private sector (% of GDP)

Cette statistique dans les autres pays:

AlbaniaAlgeriaAngolaAntigua and BarbudaArmeniaAustraliaAzerbaijanBangladeshBarbadosBelarusBelizeBeninBhutanBoliviaBosnia and HerzegovinaBotswanaBrazilBulgariaBurkina FasoBurundiCabo VerdeCambodiaCameroonCaribbean small statesCentral African RepublicChadColombiaComorosCongo, Dem. Rep.Congo, Rep.Costa RicaCote d'IvoireCroatiaDjiboutiDominicaDominican RepublicEarly-demographic dividendEcuadorEgypt, Arab Rep.El SalvadorEquatorial GuineaEritreaEthiopiaEurope & Central Asia (excluding high income)Europe & Central Asia (IDA & IBRD countries)FijiGabonGambia, TheGeorgiaGhanaGrenadaGuatemalaGuineaGuinea-BissauGuyanaHaitiHeavily indebted poor countries (HIPC)HondurasHong Kong SAR, ChinaIDA onlyIndiaIran, Islamic Rep.IraqJamaicaJapanJordanKazakhstanKenyaKosovoKyrgyz RepublicLao PDRLatin America & Caribbean Latin America & Caribbean (excluding high income)Latin America & the Caribbean (IDA & IBRD countries)Least developed countries: UN classificationLebanonLesothoLiberiaLibyaLow incomeLower middle incomeMacedonia, FYRMadagascarMalawiMalaysiaMaliMauritaniaMauritiusMexicoMiddle East & North Africa (excluding high income)Middle East & North Africa (IDA & IBRD countries)MoldovaMongoliaMontenegroMozambiqueNamibiaNepalNicaraguaNigerNorth AmericaOmanPakistanPanamaPapua New GuineaParaguayPeruPhilippinesRomaniaRussian FederationRwandaSenegalSerbiaSeychellesSierra LeoneSouth AfricaSouth AsiaSouth Asia (IDA & IBRD)South SudanSri LankaSt. Kitts and NevisSt. LuciaSt. Vincent and the GrenadinesSub-Saharan Africa Sub-Saharan Africa (excluding high income)Sub-Saharan Africa (IDA & IBRD countries)SudanSurinameSwazilandSyrian Arab RepublicTajikistanTanzaniaThailandTimor-LesteTogoTrinidad and TobagoTunisiaTurkeyTurkmenistanUgandaUkraineUnited Arab EmiratesUnited StatesUruguayUzbekistanVenezuela, RBYemen, Rep.Zimbabwe

La ligne de temps

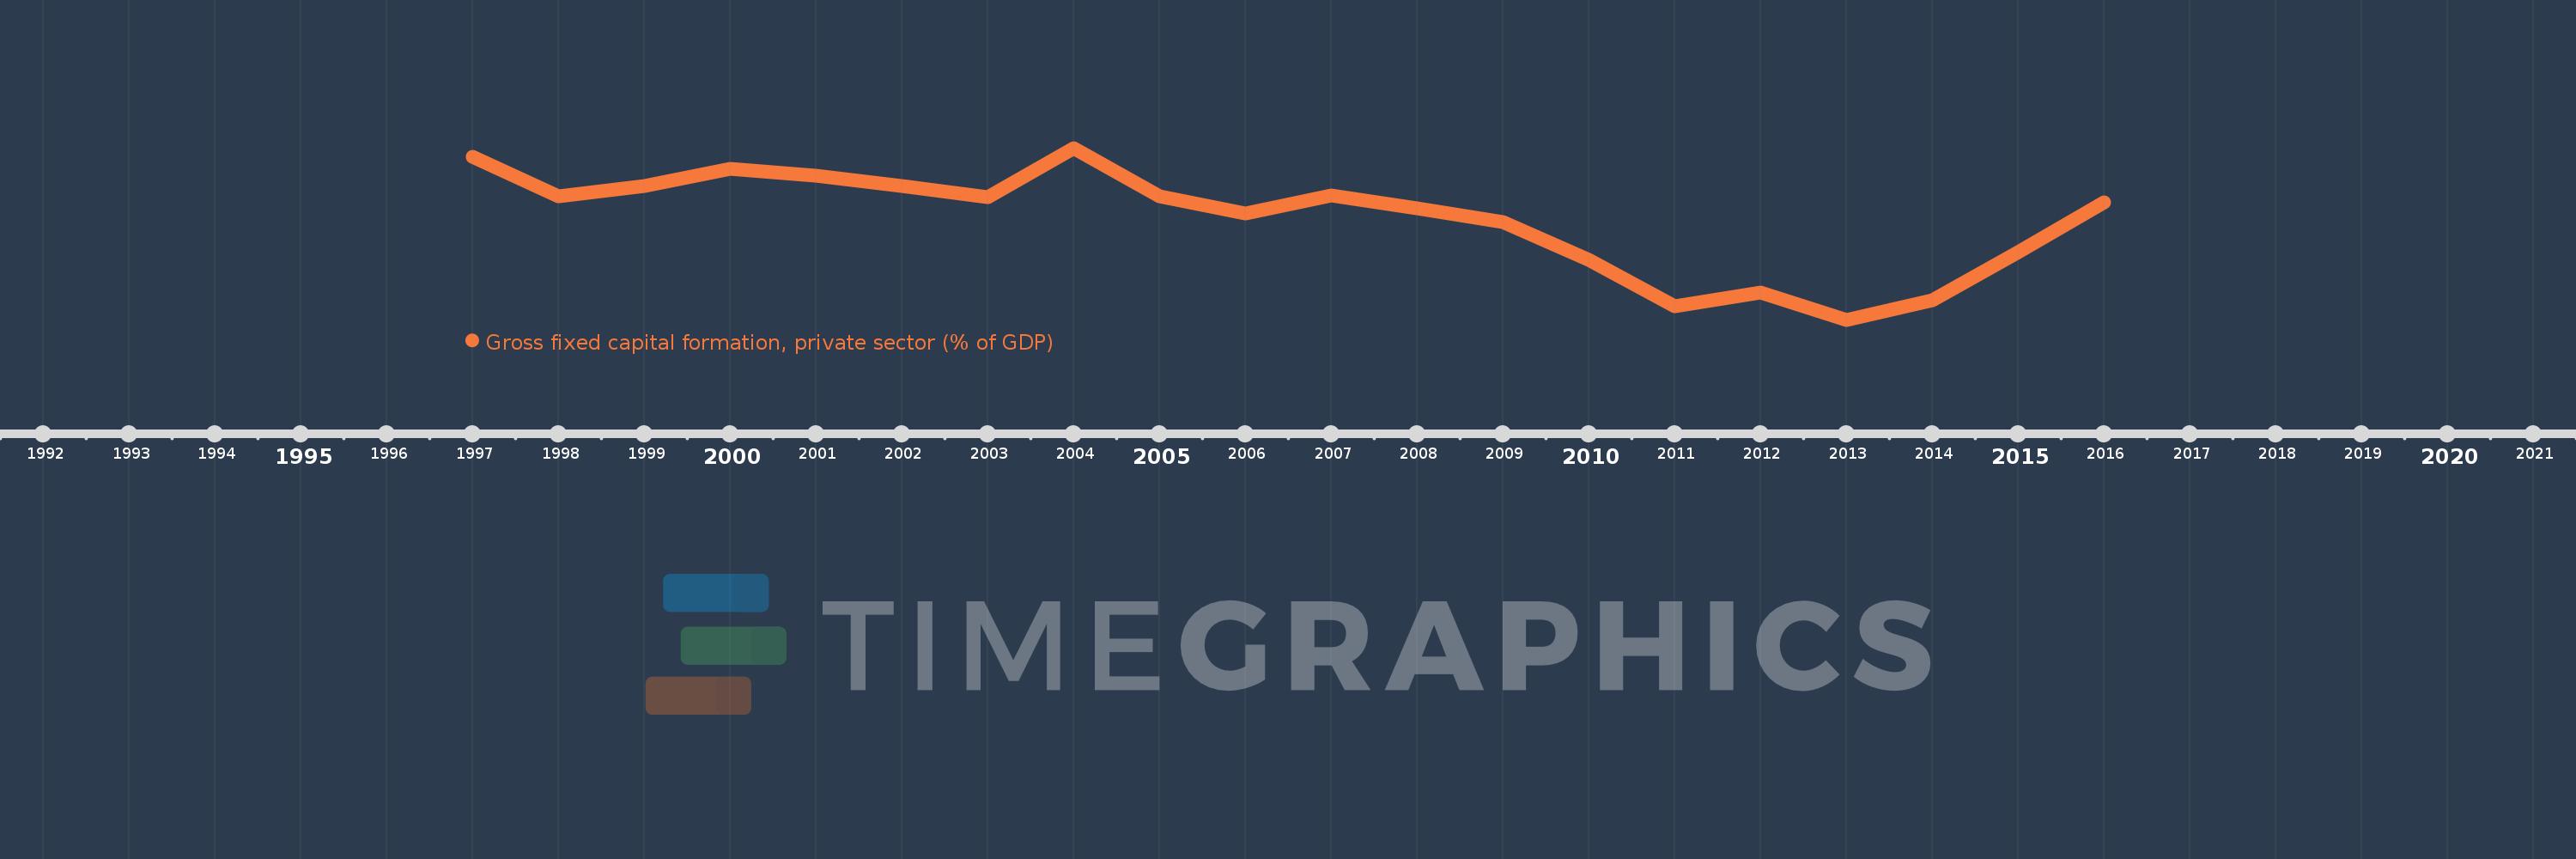
Cette échelle de temps montre un graphique de 1997 année à 2016 année Haiti. Les données jusqu'à 1996 année ne sont pas présentés. Quantité d'observations actuelles selon dates: 20.

Source (désignation):

Les indicateurs du développement mondiale

Source (organisation):

World Bank national accounts data, and OECD National Accounts data files.

Catégories:

Economy & Growth

Dernière mise à jour

23 avr. 2017

Les indicateurs de changement de valeurs selon les années

En moyenne:
21.107
Minimum:
12.196
1 janv. 2013
Maximum:
27.414
1 janv. 2004
Pour la date d''observation
Valeur
Changement absolu
Le changement par rapport à la valeur précédente
1 janv. 1997
26.598
+26.598
0.0%
1 janv. 1998
23.165
-3.433
-12.91%
1 janv. 1999
24.07
+0.905
3.91%
1 janv. 2000
25.55
+1.48
6.15%
1 janv. 2001
24.961
-0.589
-2.3%
1 janv. 2002
24.014
-0.947
-3.79%
1 janv. 2003
23.038
-0.976
-4.07%
1 janv. 2004
27.414
+4.376
18.99%
1 janv. 2005
23.122
-4.291
-15.65%
1 janv. 2006
21.629
-1.494
-6.46%
1 janv. 2007
23.218
+1.589
7.35%
1 janv. 2008
22.069
-1.149
-4.95%
1 janv. 2009
20.859
-1.21
-5.48%
1 janv. 2010
17.533
-3.326
-15.95%
1 janv. 2011
13.424
-4.109
-23.43%
1 janv. 2012
14.596
+1.171
8.73%
1 janv. 2013
12.196
-2.399
-16.44%
1 janv. 2014
13.912
+1.716
14.07%
1 janv. 2015
18.201
+4.289
30.83%
1 janv. 2016
22.574
+4.373
24.03%

Classement des pays selon les statistiques actuelles par années