33
/fr/
AIzaSyAYiBZKx7MnpbEhh9jyipgxe19OcubqV5w
August 1, 2025
128363
Eritrea
ERI
true
2
1
Gross fixed capital formation, private sector (% of GDP)
2012,2011,2010,2009,2008,2007,2006,2005,2004,2003,2002,2001,2000,1999,1998,1997,1996,1995,1994,1993
Download
Bibliothèque de statistiques globales →Eritrea →

Gross fixed capital formation, private sector (% of GDP)

Cette statistique dans les autres pays:

AlbaniaAlgeriaAngolaAntigua and BarbudaArmeniaAustraliaAzerbaijanBangladeshBarbadosBelarusBelizeBeninBhutanBoliviaBosnia and HerzegovinaBotswanaBrazilBulgariaBurkina FasoBurundiCabo VerdeCambodiaCameroonCaribbean small statesCentral African RepublicChadColombiaComorosCongo, Dem. Rep.Congo, Rep.Costa RicaCote d'IvoireCroatiaDjiboutiDominicaDominican RepublicEarly-demographic dividendEcuadorEgypt, Arab Rep.El SalvadorEquatorial GuineaEritreaEthiopiaEurope & Central Asia (excluding high income)Europe & Central Asia (IDA & IBRD countries)FijiGabonGambia, TheGeorgiaGhanaGrenadaGuatemalaGuineaGuinea-BissauGuyanaHaitiHeavily indebted poor countries (HIPC)HondurasHong Kong SAR, ChinaIDA onlyIndiaIran, Islamic Rep.IraqJamaicaJapanJordanKazakhstanKenyaKosovoKyrgyz RepublicLao PDRLatin America & Caribbean Latin America & Caribbean (excluding high income)Latin America & the Caribbean (IDA & IBRD countries)Least developed countries: UN classificationLebanonLesothoLiberiaLibyaLow incomeLower middle incomeMacedonia, FYRMadagascarMalawiMalaysiaMaliMauritaniaMauritiusMexicoMiddle East & North Africa (excluding high income)Middle East & North Africa (IDA & IBRD countries)MoldovaMongoliaMontenegroMozambiqueNamibiaNepalNicaraguaNigerNorth AmericaOmanPakistanPanamaPapua New GuineaParaguayPeruPhilippinesRomaniaRussian FederationRwandaSenegalSerbiaSeychellesSierra LeoneSouth AfricaSouth AsiaSouth Asia (IDA & IBRD)South SudanSri LankaSt. Kitts and NevisSt. LuciaSt. Vincent and the GrenadinesSub-Saharan Africa Sub-Saharan Africa (excluding high income)Sub-Saharan Africa (IDA & IBRD countries)SudanSurinameSwazilandSyrian Arab RepublicTajikistanTanzaniaThailandTimor-LesteTogoTrinidad and TobagoTunisiaTurkeyTurkmenistanUgandaUkraineUnited Arab EmiratesUnited StatesUruguayUzbekistanVenezuela, RBYemen, Rep.Zimbabwe

La ligne de temps

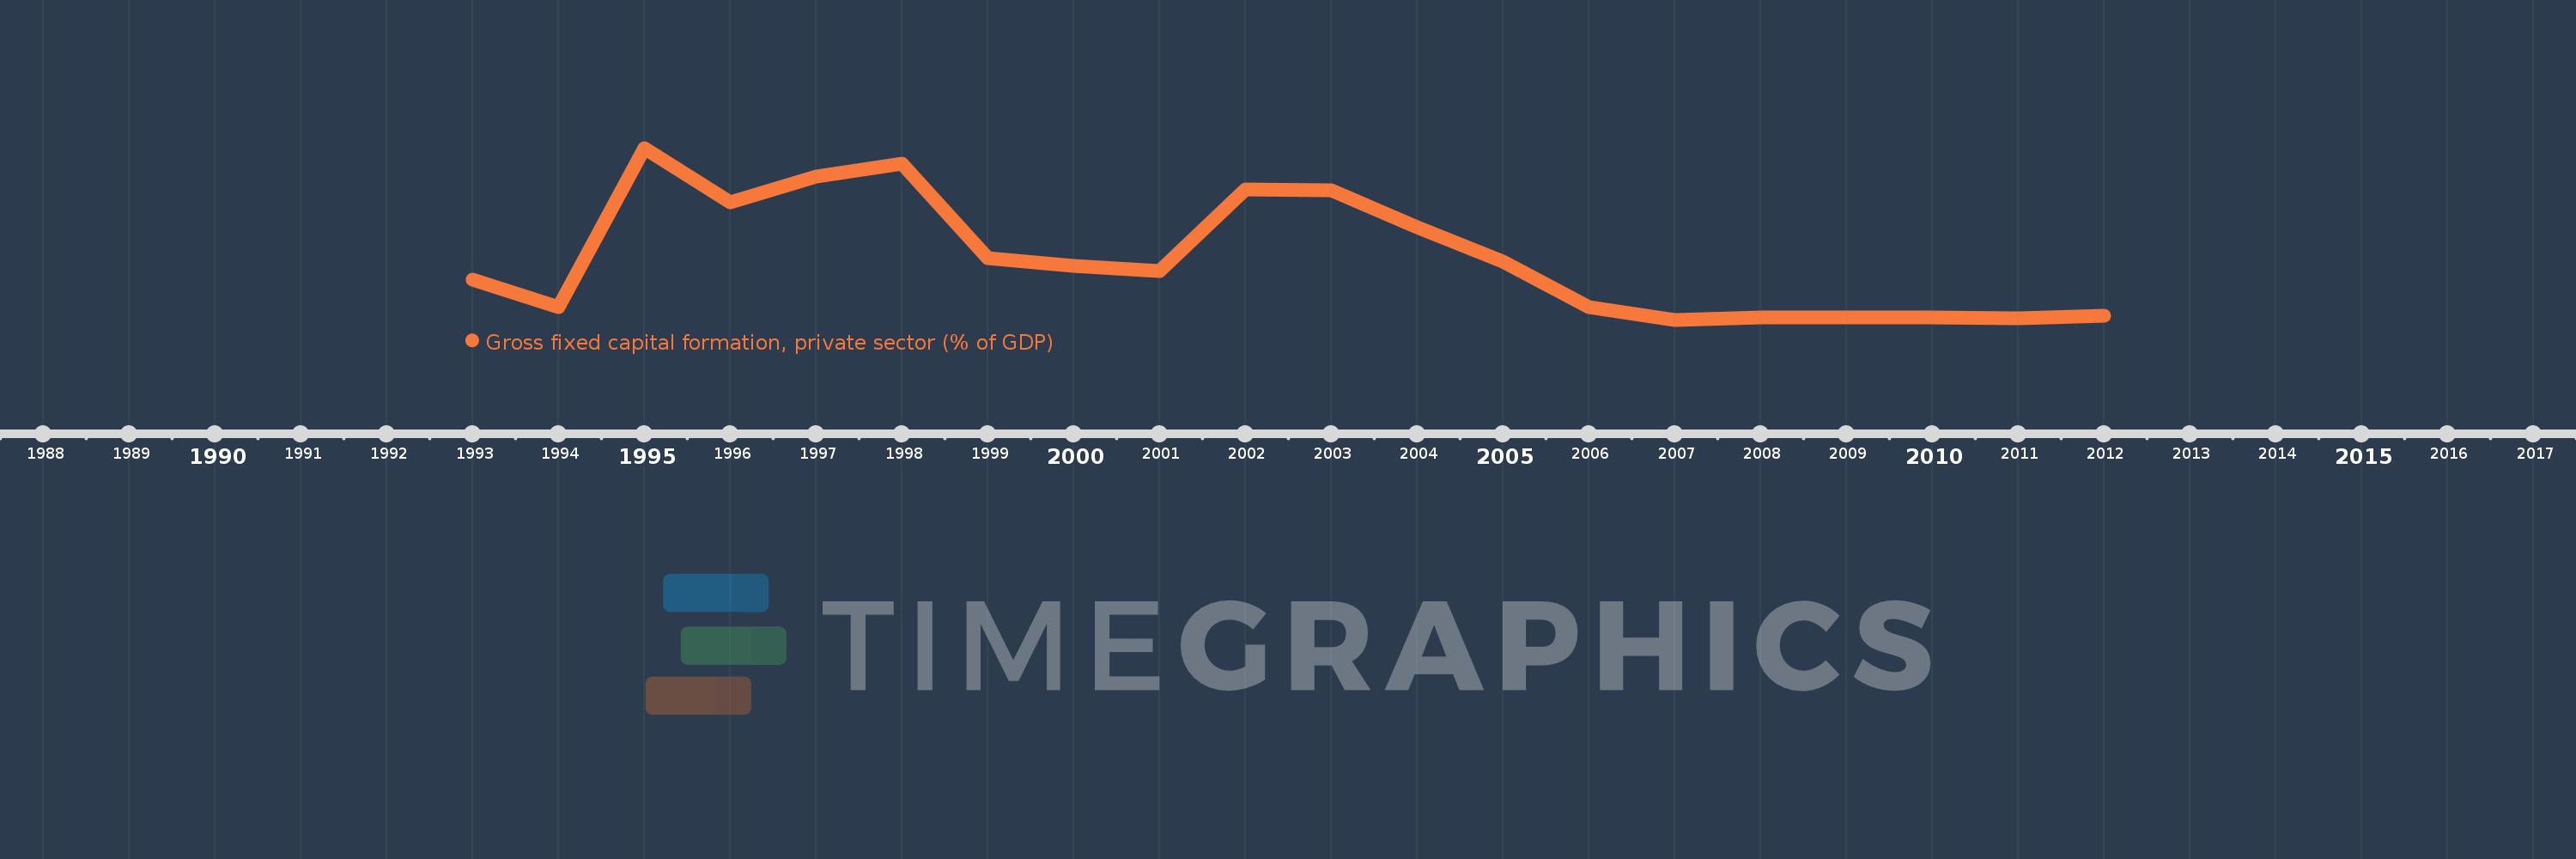
Cette échelle de temps montre un graphique de 1993 année à 2012 année Eritrea. Les données jusqu'à 1992 année ne sont pas présentés. Quantité d'observations actuelles selon dates: 20.

Source (désignation):

Les indicateurs du développement mondiale

Source (organisation):

World Bank national accounts data, and OECD National Accounts data files.

Catégories:

Economy & Growth

Dernière mise à jour

23 avr. 2017

Les indicateurs de changement de valeurs selon les années

En moyenne:
6.16
Minimum:
1.533
1 janv. 2007
Maximum:
14.329
1 janv. 1995
Pour la date d''observation
Valeur
Changement absolu
Le changement par rapport à la valeur précédente
1 janv. 1993
4.55
+4.55
0.0%
1 janv. 1994
2.481
-2.069
-45.48%
1 janv. 1995
14.329
+11.848
477.55%
1 janv. 1996
10.267
-4.062
-28.35%
1 janv. 1997
12.215
+1.948
18.97%
1 janv. 1998
13.167
+0.952
7.8%
1 janv. 1999
6.098
-7.069
-53.69%
1 janv. 2000
5.53
-0.567
-9.3%
1 janv. 2001
5.143
-0.387
-7.0%
1 janv. 2002
11.269
+6.126
119.1%
1 janv. 2003
11.182
-0.087
-0.77%
1 janv. 2004
8.445
-2.737
-24.48%
1 janv. 2005
5.875
-2.57
-30.44%
1 janv. 2006
2.47
-3.405
-57.96%
1 janv. 2007
1.533
-0.937
-37.92%
1 janv. 2008
1.701
+0.167
10.92%
1 janv. 2009
1.731
+0.03
1.76%
1 janv. 2010
1.715
-0.016
-0.9%
1 janv. 2011
1.654
-0.061
-3.58%
1 janv. 2012
1.855
+0.202
12.21%

Classement des pays selon les statistiques actuelles par années