33
/fr/
AIzaSyAYiBZKx7MnpbEhh9jyipgxe19OcubqV5w
August 1, 2025
71507
Armenia
ARM
true
2
1
Net capital account (BoP, current US$)
2016,2015,2014,2013,2012,2011,2010,2009,2008,2007,2006,2005,2004,2003,2002,2001,2000,1999,1998,1997,1996,1995,1994
Download
Bibliothèque de statistiques globales →Armenia →

Net capital account (BoP, current US$)

Cette statistique dans les autres pays:

AfghanistanAlbaniaAlgeriaAngolaAntigua and BarbudaArgentinaArmeniaArubaAustraliaAustriaAzerbaijanBahrainBangladeshBarbadosBelarusBelgiumBelizeBeninBhutanBoliviaBosnia and HerzegovinaBotswanaBrazilBrunei DarussalamBulgariaBurkina FasoBurundiCabo VerdeCambodiaCameroonCanadaChadChileChinaComorosCongo, Dem. Rep.Congo, Rep.Costa RicaCote d'IvoireCroatiaCuracaoCyprusCzech RepublicDenmarkDjiboutiDominicaDominican RepublicEcuadorEgypt, Arab Rep.El SalvadorEquatorial GuineaEritreaEstoniaEthiopiaEuro areaFijiFinlandFranceFrench PolynesiaGabonGambia, TheGeorgiaGermanyGhanaGreeceGrenadaGuatemalaGuineaGuinea-BissauGuyanaHaitiHondurasHong Kong SAR, ChinaHungaryIcelandIndiaIndonesiaIraqIrelandIsraelItalyJamaicaJapanJordanKazakhstanKenyaKiribatiKorea, Rep.KosovoKuwaitKyrgyz RepublicLatviaLebanonLesothoLiberiaLithuaniaLuxembourgMacao SAR, ChinaMacedonia, FYRMadagascarMalawiMalaysiaMaldivesMaliMaltaMarshall IslandsMauritaniaMauritiusMicronesia, Fed. Sts.MoldovaMongoliaMontenegroMoroccoMozambiqueMyanmarNamibiaNepalNetherlandsNew CaledoniaNew ZealandNicaraguaNigerNigeriaNorwayOmanPakistanPalauPanamaPapua New GuineaParaguayPeruPhilippinesPolandPortugalQatarRomaniaRussian FederationRwandaSamoaSao Tome and PrincipeSaudi ArabiaSenegalSerbiaSeychellesSierra LeoneSingaporeSint Maarten (Dutch part)Slovak RepublicSloveniaSolomon IslandsSouth AfricaSouth SudanSpainSri LankaSt. Kitts and NevisSt. LuciaSt. Vincent and the GrenadinesSudanSurinameSwazilandSwedenSwitzerlandSyrian Arab RepublicTajikistanTanzaniaThailandTimor-LesteTogoTongaTunisiaTurkeyTuvaluUgandaUkraineUnited KingdomUnited StatesUruguayVanuatuVenezuela, RBWest Bank and GazaYemen, Rep.ZambiaZimbabwe

La ligne de temps

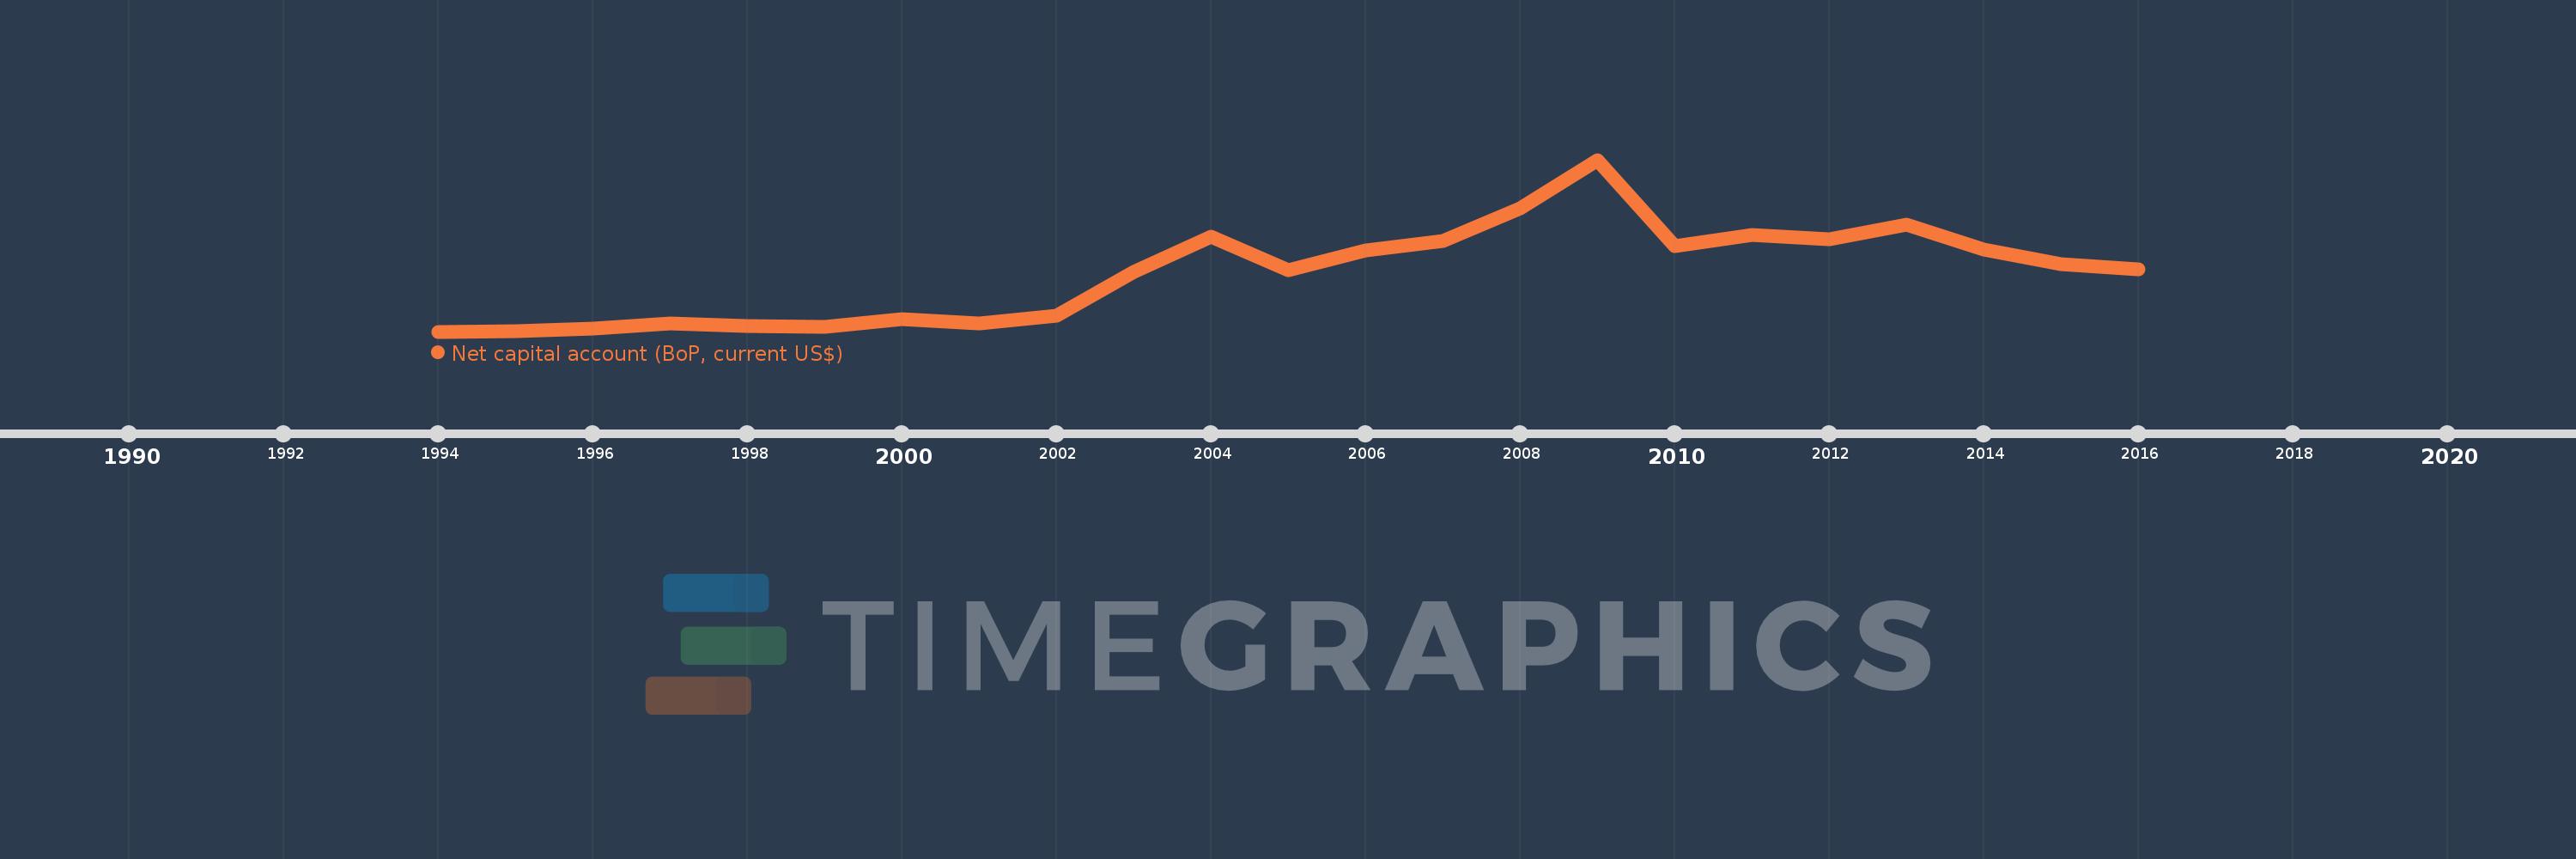
Cette échelle de temps montre un graphique de 1994 année à 2016 année Armenia. Les données jusqu'à 1993 année ne sont pas présentés. Quantité d'observations actuelles selon dates: 23.

Source (désignation):

Les indicateurs du développement mondiale

Source (organisation):

International Monetary Fund, Balance of Payments Statistics Yearbook and data files.

Catégories:

Economy & Growth

Dernière mise à jour

23 avr. 2017

Les indicateurs de changement de valeurs selon les années

En moyenne:
61.337 mln.
Minimum:
5.1 mln.
1 janv. 1994
Maximum:
171.437 mln.
1 janv. 2009
Pour la date d''observation
Valeur
Changement absolu
Le changement par rapport à la valeur précédente
1 janv. 1994
5.1 mln.
+5.1 mln.
0.0%
1 janv. 1995
5.74 mln.
+640.0 milles
12.55%
1 janv. 1996
8.05 mln.
+2.31 mln.
40.24%
1 janv. 1997
13.4 mln.
+5.35 mln.
66.46%
1 janv. 1998
10.88 mln.
-2.52 mln.
-18.81%
1 janv. 1999
9.74 mln.
-1.14 mln.
-10.48%
1 janv. 2000
16.85 mln.
+7.11 mln.
73.0%
1 janv. 2001
13.0 mln.
-3.85 mln.
-22.85%
1 janv. 2002
20.787 mln.
+7.787 mln.
59.9%
1 janv. 2003
63.038 mln.
+42.251 mln.
203.26%
1 janv. 2004
96.923 mln.
+33.885 mln.
53.75%
1 janv. 2005
64.317 mln.
-32.606 mln.
-33.64%
1 janv. 2006
84.0 mln.
+19.684 mln.
30.6%
1 janv. 2007
92.814 mln.
+8.814 mln.
10.49%
1 janv. 2008
124.833 mln.
+32.018 mln.
34.5%
1 janv. 2009
171.437 mln.
+46.604 mln.
37.33%
1 janv. 2010
87.882 mln.
-83.555 mln.
-48.74%
1 janv. 2011
98.861 mln.
+10.979 mln.
12.49%
1 janv. 2012
94.6 mln.
-4.262 mln.
-4.31%
1 janv. 2013
108.415 mln.
+13.816 mln.
14.6%
1 janv. 2014
84.382 mln.
-24.034 mln.
-22.17%
1 janv. 2015
70.427 mln.
-13.955 mln.
-16.54%
1 janv. 2016
65.275 mln.
-5.152 mln.
-7.31%

Classement des pays selon les statistiques actuelles par années