33
/fr/
AIzaSyAYiBZKx7MnpbEhh9jyipgxe19OcubqV5w
August 1, 2025
249089
Sri Lanka
LKA
true
2
1
Net capital account (BoP, current US$)
2016,2015,2014,2013,2012,2011,2010,2009,2008,2007,2006,2005,2004,2003,2002,2001,2000,1999,1998,1997,1996
Download
Bibliothèque de statistiques globales →Sri Lanka →

Net capital account (BoP, current US$)

Cette statistique dans les autres pays:

AfghanistanAlbaniaAlgeriaAngolaAntigua and BarbudaArgentinaArmeniaArubaAustraliaAustriaAzerbaijanBahrainBangladeshBarbadosBelarusBelgiumBelizeBeninBhutanBoliviaBosnia and HerzegovinaBotswanaBrazilBrunei DarussalamBulgariaBurkina FasoBurundiCabo VerdeCambodiaCameroonCanadaChadChileChinaComorosCongo, Dem. Rep.Congo, Rep.Costa RicaCote d'IvoireCroatiaCuracaoCyprusCzech RepublicDenmarkDjiboutiDominicaDominican RepublicEcuadorEgypt, Arab Rep.El SalvadorEquatorial GuineaEritreaEstoniaEthiopiaEuro areaFijiFinlandFranceFrench PolynesiaGabonGambia, TheGeorgiaGermanyGhanaGreeceGrenadaGuatemalaGuineaGuinea-BissauGuyanaHaitiHondurasHong Kong SAR, ChinaHungaryIcelandIndiaIndonesiaIraqIrelandIsraelItalyJamaicaJapanJordanKazakhstanKenyaKiribatiKorea, Rep.KosovoKuwaitKyrgyz RepublicLatviaLebanonLesothoLiberiaLithuaniaLuxembourgMacao SAR, ChinaMacedonia, FYRMadagascarMalawiMalaysiaMaldivesMaliMaltaMarshall IslandsMauritaniaMauritiusMicronesia, Fed. Sts.MoldovaMongoliaMontenegroMoroccoMozambiqueMyanmarNamibiaNepalNetherlandsNew CaledoniaNew ZealandNicaraguaNigerNigeriaNorwayOmanPakistanPalauPanamaPapua New GuineaParaguayPeruPhilippinesPolandPortugalQatarRomaniaRussian FederationRwandaSamoaSao Tome and PrincipeSaudi ArabiaSenegalSerbiaSeychellesSierra LeoneSingaporeSint Maarten (Dutch part)Slovak RepublicSloveniaSolomon IslandsSouth AfricaSouth SudanSpainSri LankaSt. Kitts and NevisSt. LuciaSt. Vincent and the GrenadinesSudanSurinameSwazilandSwedenSwitzerlandSyrian Arab RepublicTajikistanTanzaniaThailandTimor-LesteTogoTongaTunisiaTurkeyTuvaluUgandaUkraineUnited KingdomUnited StatesUruguayVanuatuVenezuela, RBWest Bank and GazaYemen, Rep.ZambiaZimbabwe

La ligne de temps

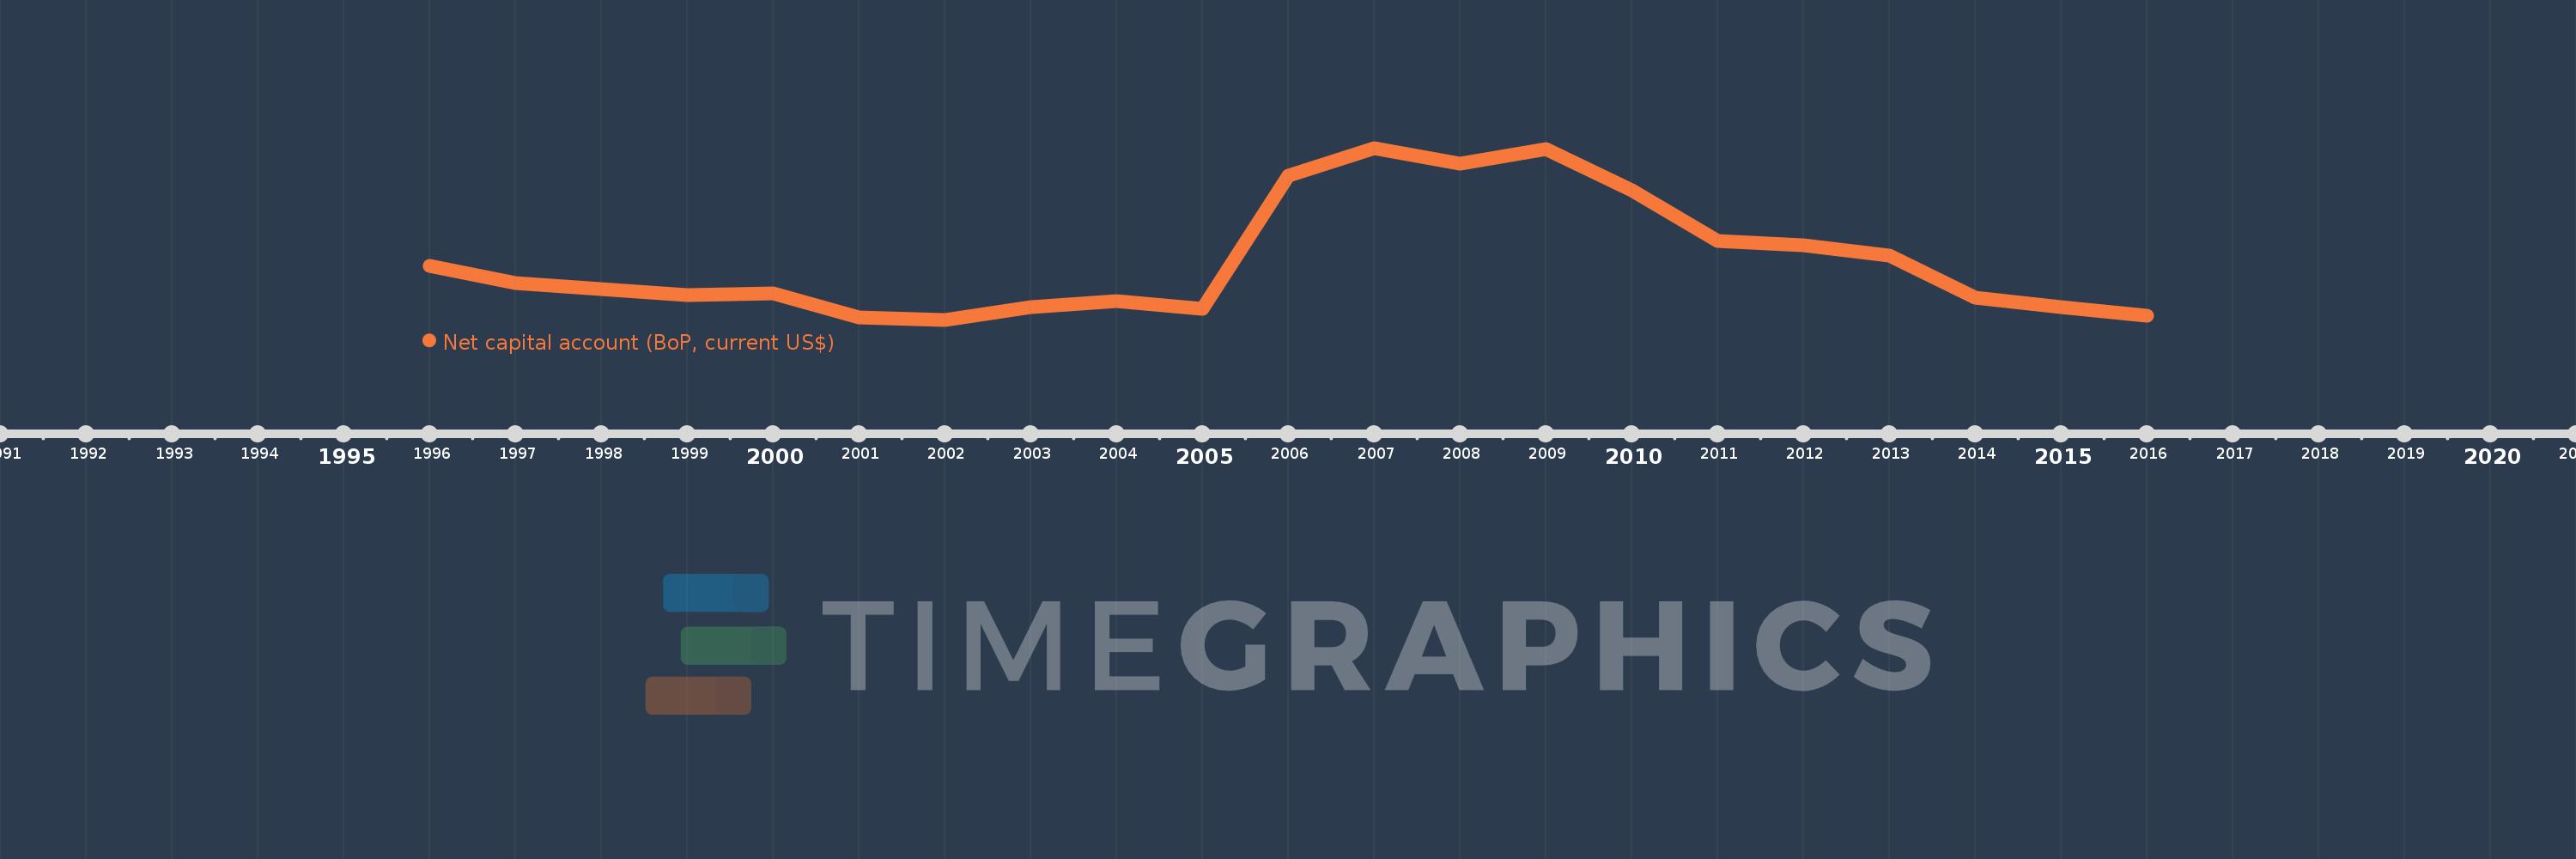
Cette échelle de temps montre un graphique de 1996 année à 2016 année Sri Lanka. Les données jusqu'à 1995 année ne sont pas présentés. Quantité d'observations actuelles selon dates: 21.

Source (désignation):

Les indicateurs du développement mondiale

Source (organisation):

International Monetary Fund, Balance of Payments Statistics Yearbook and data files.

Catégories:

Economy & Growth

Dernière mise à jour

23 avr. 2017

Les indicateurs de changement de valeurs selon les années

En moyenne:
123.243 mln.
Minimum:
40.05 mln.
1 janv. 2002
Maximum:
281.1 mln.
1 janv. 2007
Pour la date d''observation
Valeur
Changement absolu
Le changement par rapport à la valeur précédente
1 janv. 1996
116.205 mln.
+116.205 mln.
0.0%
1 janv. 1997
91.259 mln.
-24.946 mln.
-21.47%
1 janv. 1998
82.622 mln.
-8.637 mln.
-9.46%
1 janv. 1999
74.5 mln.
-8.122 mln.
-9.83%
1 janv. 2000
77.147 mln.
+2.647 mln.
3.55%
1 janv. 2001
43.486 mln.
-33.661 mln.
-43.63%
1 janv. 2002
40.05 mln.
-3.436 mln.
-7.9%
1 janv. 2003
57.9 mln.
+17.85 mln.
44.57%
1 janv. 2004
66.26 mln.
+8.36 mln.
14.44%
1 janv. 2005
55.03 mln.
-11.23 mln.
-16.95%
1 janv. 2006
242.0 mln.
+186.97 mln.
339.76%
1 janv. 2007
281.1 mln.
+39.1 mln.
16.16%
1 janv. 2008
259.05 mln.
-22.05 mln.
-7.84%
1 janv. 2009
279.7 mln.
+20.65 mln.
7.97%
1 janv. 2010
221.2 mln.
-58.5 mln.
-20.92%
1 janv. 2011
150.45 mln.
-70.75 mln.
-31.98%
1 janv. 2012
144.36 mln.
-6.09 mln.
-4.05%
1 janv. 2013
130.343 mln.
-14.017 mln.
-9.71%
1 janv. 2014
70.885 mln.
-59.458 mln.
-45.62%
1 janv. 2015
58.255 mln.
-12.63 mln.
-17.82%
1 janv. 2016
46.299 mln.
-11.956 mln.
-20.52%

Classement des pays selon les statistiques actuelles par années