29
/fr/
fr
AIzaSyAYiBZKx7MnpbEhh9jyipgxe19OcubqV5w
April 1, 2024
177969
Lesotho
LSO
true
2
1
Net capital account (BoP, current US$)
2016,2015,2014,2013,2012,2011,2010,2009,2008,2007,2006,2005,2004,2003,2002,2001,2000,1999,1998,1997,1996
Download
Bibliothèque de statistiques globales →Lesotho →

Net capital account (BoP, current US$)

Cette statistique dans les autres pays:
AfghanistanAlbaniaAlgeriaAngolaAntigua and BarbudaArgentinaArmeniaArubaAustraliaAustriaAzerbaijanBahrainBangladeshBarbadosBelarusBelgiumBelizeBeninBhutanBoliviaBosnia and HerzegovinaBotswanaBrazilBrunei DarussalamBulgariaBurkina FasoBurundiCabo VerdeCambodiaCameroonCanadaChadChileChinaComorosCongo, Dem. Rep.Congo, Rep.Costa RicaCote d'IvoireCroatiaCuracaoCyprusCzech RepublicDenmarkDjiboutiDominicaDominican RepublicEcuadorEgypt, Arab Rep.El SalvadorEquatorial GuineaEritreaEstoniaEthiopiaEuro areaFijiFinlandFranceFrench PolynesiaGabonGambia, TheGeorgiaGermanyGhanaGreeceGrenadaGuatemalaGuineaGuinea-BissauGuyanaHaitiHondurasHong Kong SAR, ChinaHungaryIcelandIndiaIndonesiaIraqIrelandIsraelItalyJamaicaJapanJordanKazakhstanKenyaKiribatiKorea, Rep.KosovoKuwaitKyrgyz RepublicLatviaLebanonLesothoLiberiaLithuaniaLuxembourgMacao SAR, ChinaMacedonia, FYRMadagascarMalawiMalaysiaMaldivesMaliMaltaMarshall IslandsMauritaniaMauritiusMicronesia, Fed. Sts.MoldovaMongoliaMontenegroMoroccoMozambiqueMyanmarNamibiaNepalNetherlandsNew CaledoniaNew ZealandNicaraguaNigerNigeriaNorwayOmanPakistanPalauPanamaPapua New GuineaParaguayPeruPhilippinesPolandPortugalQatarRomaniaRussian FederationRwandaSamoaSao Tome and PrincipeSaudi ArabiaSenegalSerbiaSeychellesSierra LeoneSingaporeSint Maarten (Dutch part)Slovak RepublicSloveniaSolomon IslandsSouth AfricaSouth SudanSpainSri LankaSt. Kitts and NevisSt. LuciaSt. Vincent and the GrenadinesSudanSurinameSwazilandSwedenSwitzerlandSyrian Arab RepublicTajikistanTanzaniaThailandTimor-LesteTogoTongaTunisiaTurkeyTuvaluUgandaUkraineUnited KingdomUnited StatesUruguayVanuatuVenezuela, RBWest Bank and GazaYemen, Rep.ZambiaZimbabwe
La ligne de temps
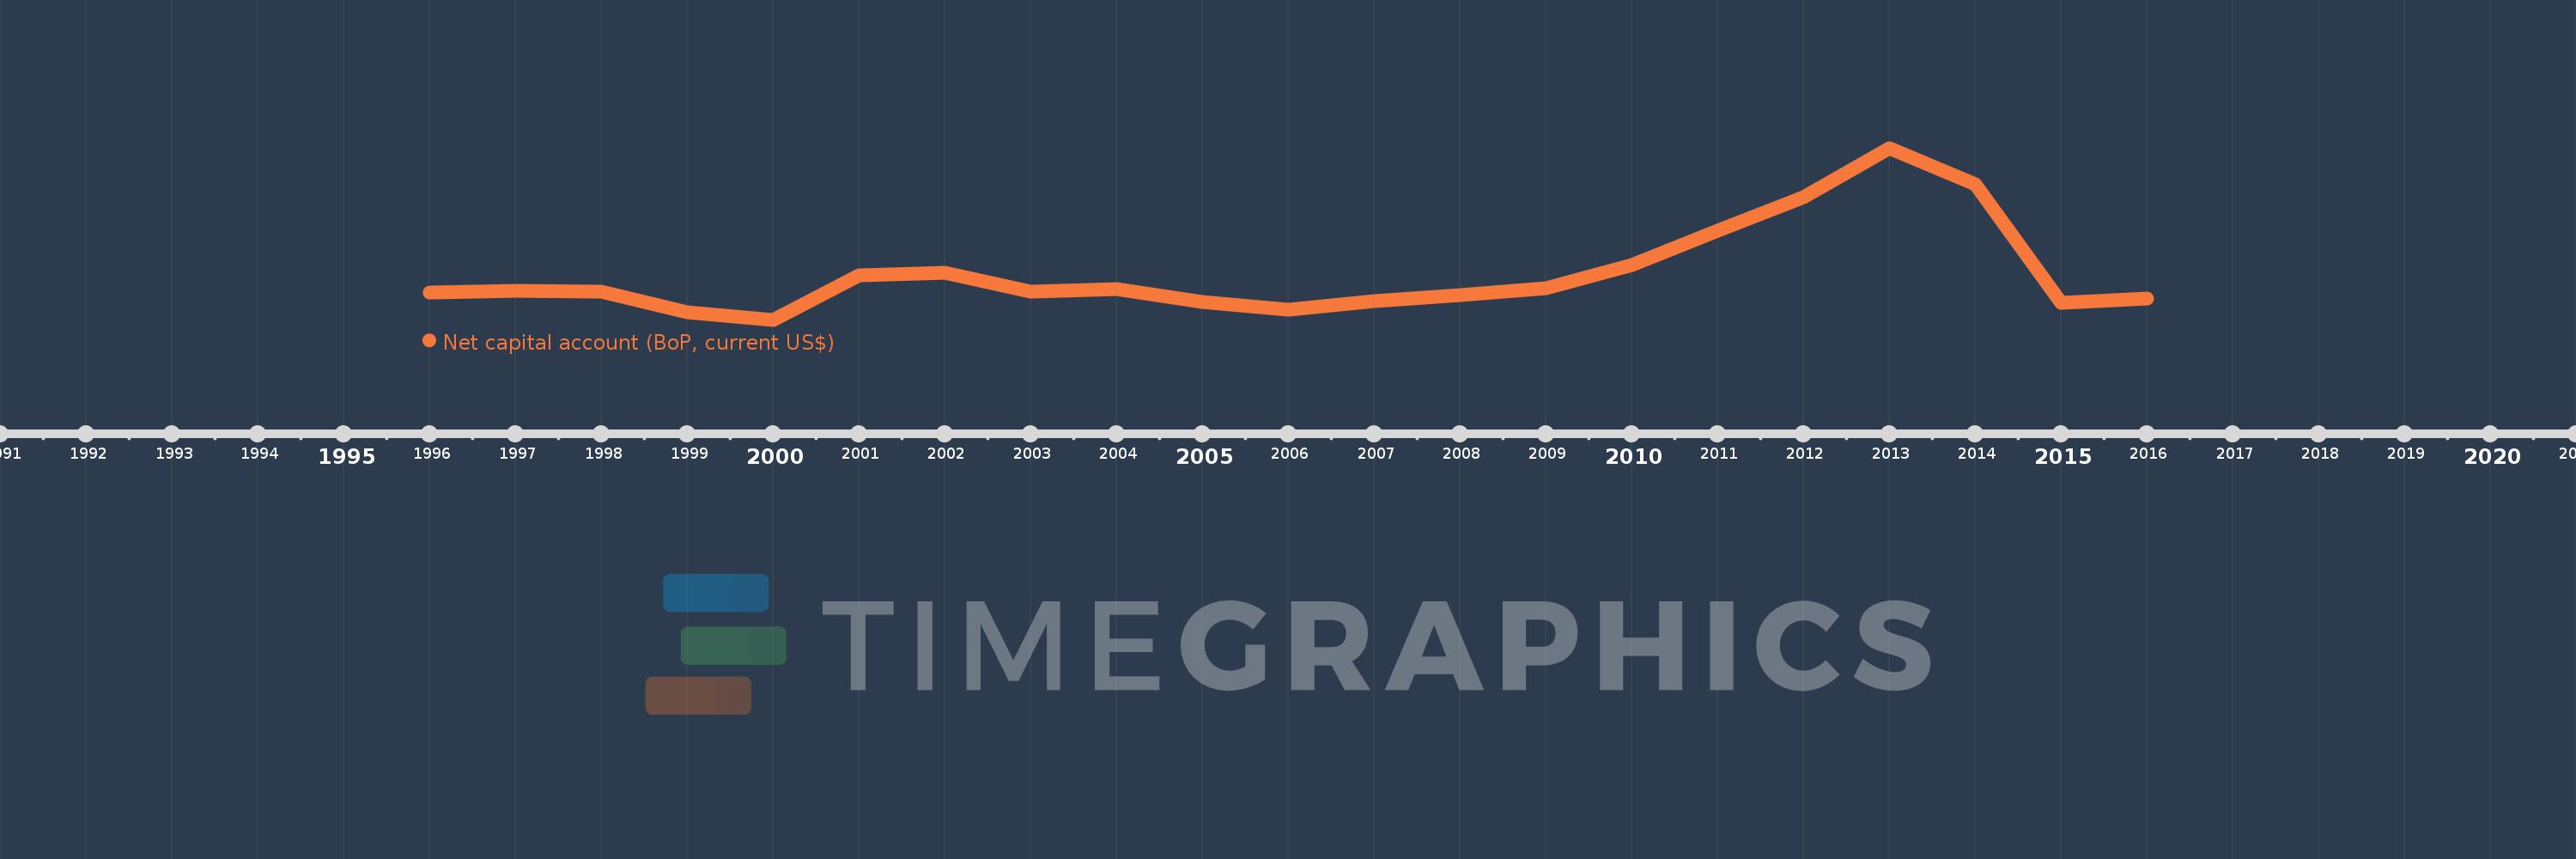
Cette échelle de temps montre un graphique de 1996 année à 2016 année Lesotho. Les données jusqu'à 1995 année ne sont pas présentés. Quantité d'observations actuelles selon dates: 21.
Source (désignation):
Les indicateurs du développement mondiale
Source (organisation):
International Monetary Fund, Balance of Payments Statistics Yearbook and data files.
Catégories:
Economy & Growth
Dernière mise à jour
23 avr. 2017
Les indicateurs de changement de valeurs selon les années
En moyenne:
62.457 mln.
Minimum:
15.198 mln.
1 janv. 2000
Maximum:
193.551 mln.
1 janv. 2013
Pour la date d''observation
Valeur
Changement absolu
Le changement par rapport à la valeur précédente
1 janv. 1996
43.654 mln.
+43.654 mln.
0.0%
1 janv. 1997
45.478 mln.
+1.825 mln.
4.18%
1 janv. 1998
44.486 mln.
-992.432 milles
-2.18%
1 janv. 1999
22.873 mln.
-21.613 mln.
-48.58%
1 janv. 2000
15.198 mln.
-7.674 mln.
-33.55%
1 janv. 2001
61.159 mln.
+45.96 mln.
302.4%
1 janv. 2002
63.863 mln.
+2.704 mln.
4.42%
1 janv. 2003
44.737 mln.
-19.126 mln.
-29.95%
1 janv. 2004
46.724 mln.
+1.987 mln.
4.44%
1 janv. 2005
33.395 mln.
-13.329 mln.
-28.53%
1 janv. 2006
25.711 mln.
-7.684 mln.
-23.01%
1 janv. 2007
34.592 mln.
+8.881 mln.
34.54%
1 janv. 2008
40.668 mln.
+6.076 mln.
17.56%
1 janv. 2009
47.492 mln.
+6.824 mln.
16.78%
1 janv. 2010
71.972 mln.
+24.48 mln.
51.55%
1 janv. 2011
107.555 mln.
+35.583 mln.
49.44%
1 janv. 2012
142.442 mln.
+34.887 mln.
32.44%
1 janv. 2013
193.551 mln.
+51.109 mln.
35.88%
1 janv. 2014
155.998 mln.
-37.553 mln.
-19.4%
1 janv. 2015
32.644 mln.
-123.354 mln.
-79.07%
1 janv. 2016
37.395 mln.
+4.751 mln.
14.56%
Classement des pays selon les statistiques actuelles par années

Commentaires:

Envoyer
PremiumAbout & FeedbackUn accordConfidentialité
logo
© 2022 Selected Technologies LLC – Morgan Hill, California