29
/fr/
fr
AIzaSyAYiBZKx7MnpbEhh9jyipgxe19OcubqV5w
April 1, 2024
133437
Finland
FIN
true
2
1
Net capital account (BoP, current US$)
2016,2015,2014,2013,2012,2011,2010,2009,2008,2007,2006,2005,2004,2003,2002,2001,2000,1999,1998,1997,1996,1992
Download
Bibliothèque de statistiques globales →Finland →

Net capital account (BoP, current US$)

Cette statistique dans les autres pays:
AfghanistanAlbaniaAlgeriaAngolaAntigua and BarbudaArgentinaArmeniaArubaAustraliaAustriaAzerbaijanBahrainBangladeshBarbadosBelarusBelgiumBelizeBeninBhutanBoliviaBosnia and HerzegovinaBotswanaBrazilBrunei DarussalamBulgariaBurkina FasoBurundiCabo VerdeCambodiaCameroonCanadaChadChileChinaComorosCongo, Dem. Rep.Congo, Rep.Costa RicaCote d'IvoireCroatiaCuracaoCyprusCzech RepublicDenmarkDjiboutiDominicaDominican RepublicEcuadorEgypt, Arab Rep.El SalvadorEquatorial GuineaEritreaEstoniaEthiopiaEuro areaFijiFinlandFranceFrench PolynesiaGabonGambia, TheGeorgiaGermanyGhanaGreeceGrenadaGuatemalaGuineaGuinea-BissauGuyanaHaitiHondurasHong Kong SAR, ChinaHungaryIcelandIndiaIndonesiaIraqIrelandIsraelItalyJamaicaJapanJordanKazakhstanKenyaKiribatiKorea, Rep.KosovoKuwaitKyrgyz RepublicLatviaLebanonLesothoLiberiaLithuaniaLuxembourgMacao SAR, ChinaMacedonia, FYRMadagascarMalawiMalaysiaMaldivesMaliMaltaMarshall IslandsMauritaniaMauritiusMicronesia, Fed. Sts.MoldovaMongoliaMontenegroMoroccoMozambiqueMyanmarNamibiaNepalNetherlandsNew CaledoniaNew ZealandNicaraguaNigerNigeriaNorwayOmanPakistanPalauPanamaPapua New GuineaParaguayPeruPhilippinesPolandPortugalQatarRomaniaRussian FederationRwandaSamoaSao Tome and PrincipeSaudi ArabiaSenegalSerbiaSeychellesSierra LeoneSingaporeSint Maarten (Dutch part)Slovak RepublicSloveniaSolomon IslandsSouth AfricaSouth SudanSpainSri LankaSt. Kitts and NevisSt. LuciaSt. Vincent and the GrenadinesSudanSurinameSwazilandSwedenSwitzerlandSyrian Arab RepublicTajikistanTanzaniaThailandTimor-LesteTogoTongaTunisiaTurkeyTuvaluUgandaUkraineUnited KingdomUnited StatesUruguayVanuatuVenezuela, RBWest Bank and GazaYemen, Rep.ZambiaZimbabwe
La ligne de temps
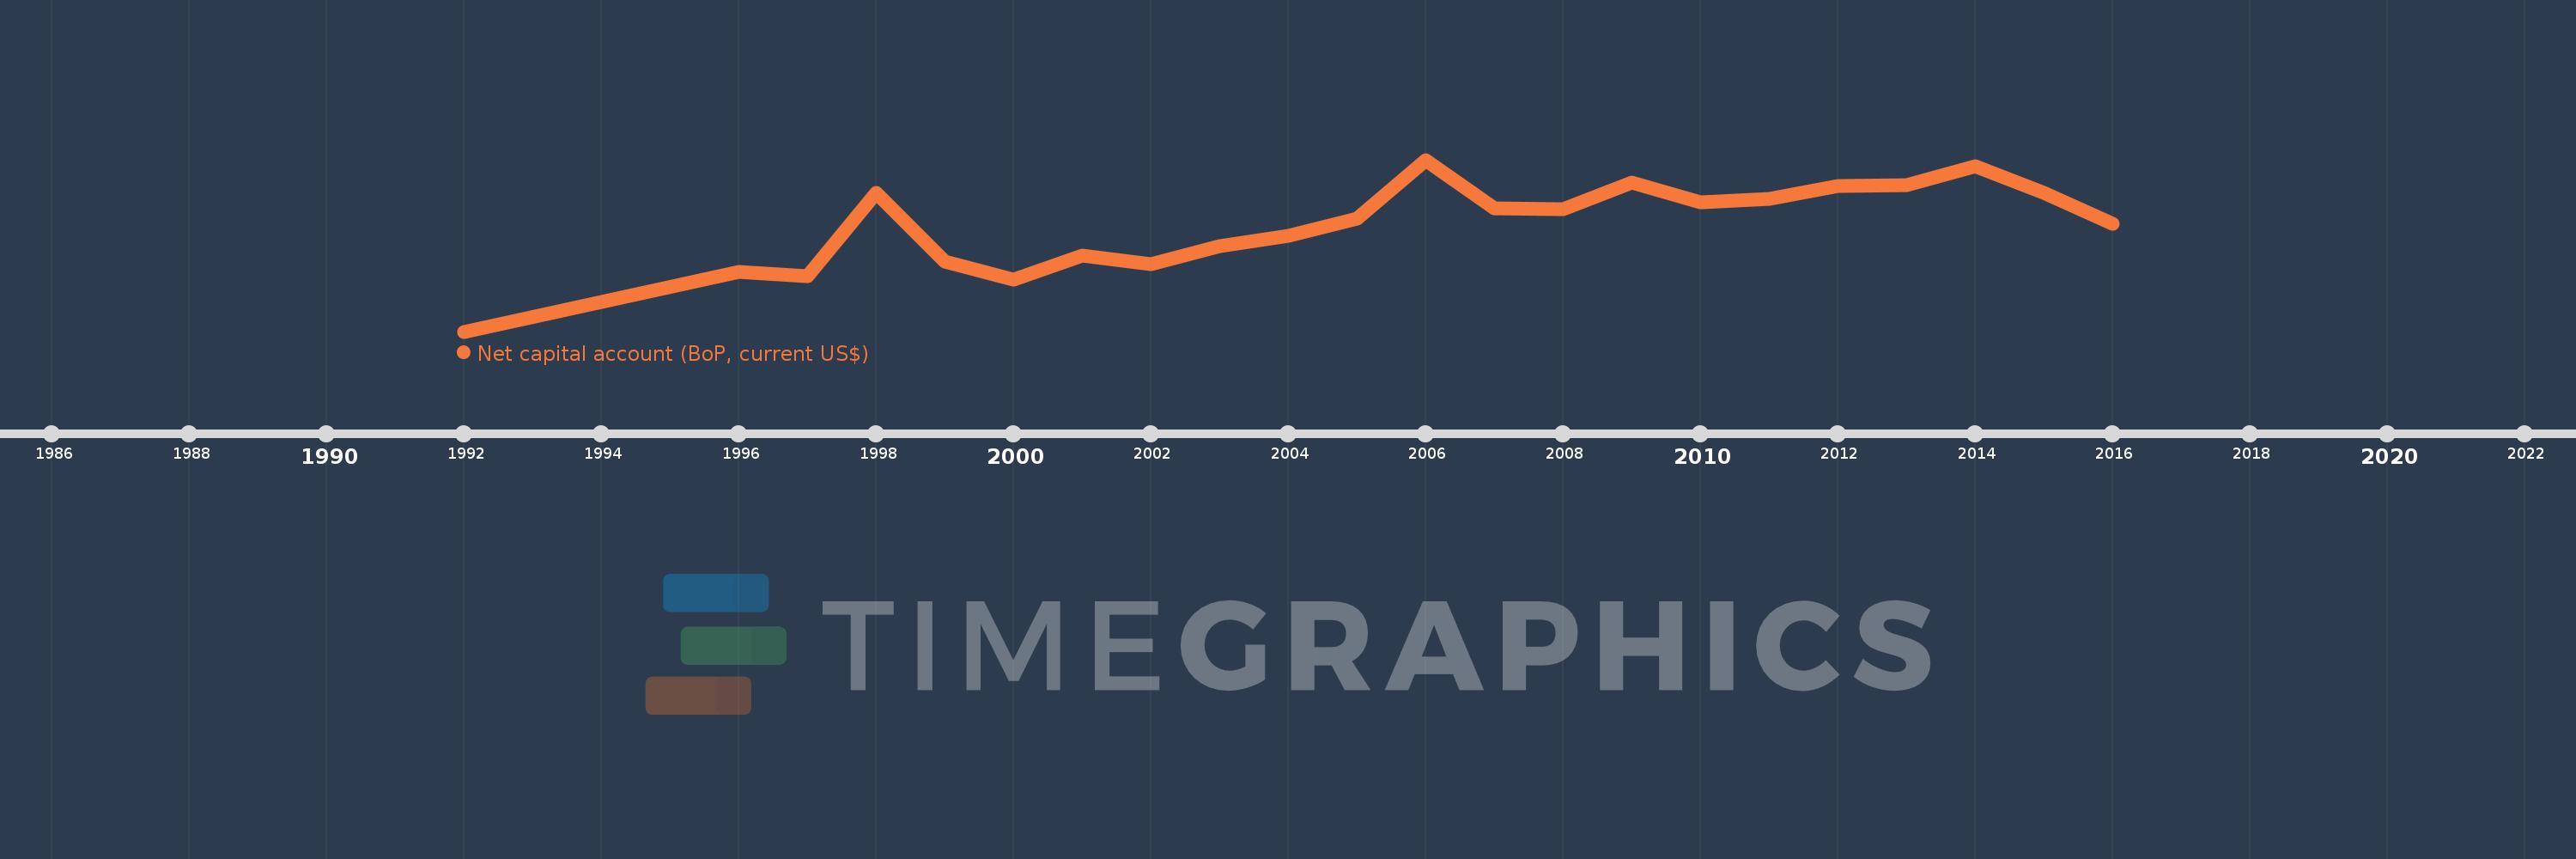
Cette échelle de temps montre un graphique de 1992 année à 2016 année Finland. Les données jusqu'à 1991 année ne sont pas présentés. Quantité d'observations actuelles selon dates: 22.
Source (désignation):
Les indicateurs du développement mondiale
Source (organisation):
International Monetary Fund, Balance of Payments Statistics Yearbook and data files.
Catégories:
Economy & Growth
Dernière mise à jour
23 avr. 2017
Les indicateurs de changement de valeurs selon les années
En moyenne:
173.93 mln.
Minimum:
-70.935 mln.
1 janv. 1992
Maximum:
323.796 mln.
1 janv. 2006
Pour la date d''observation
Valeur
Changement absolu
Le changement par rapport à la valeur précédente
1 janv. 1992
-70.935 mln.
-70.935 mln.
0.0%
1 janv. 1996
65.694 mln.
+136.629 mln.
-192.61%
1 janv. 1997
55.648 mln.
-10.046 mln.
-15.29%
1 janv. 1998
247.459 mln.
+191.811 mln.
344.69%
1 janv. 1999
90.668 mln.
-156.791 mln.
-63.36%
1 janv. 2000
48.977 mln.
-41.691 mln.
-45.98%
1 janv. 2001
103.411 mln.
+54.433 mln.
111.14%
1 janv. 2002
83.254 mln.
-20.157 mln.
-19.49%
1 janv. 2003
124.569 mln.
+41.315 mln.
49.63%
1 janv. 2004
149.175 mln.
+24.606 mln.
19.75%
1 janv. 2005
187.631 mln.
+38.457 mln.
25.78%
1 janv. 2006
323.796 mln.
+136.164 mln.
72.57%
1 janv. 2007
212.158 mln.
-111.638 mln.
-34.48%
1 janv. 2008
209.69 mln.
-2.468 mln.
-1.16%
1 janv. 2009
272.073 mln.
+62.383 mln.
29.75%
1 janv. 2010
226.965 mln.
-45.108 mln.
-16.58%
1 janv. 2011
234.22 mln.
+7.255 mln.
3.2%
1 janv. 2012
264.303 mln.
+30.082 mln.
12.84%
1 janv. 2013
264.789 mln.
+486.364 milles
0.18%
1 janv. 2014
308.245 mln.
+43.456 mln.
16.41%
1 janv. 2015
247.172 mln.
-61.073 mln.
-19.81%
1 janv. 2016
177.504 mln.
-69.668 mln.
-28.19%
Classement des pays selon les statistiques actuelles par années

Commentaires:

Envoyer
PremiumAbout & FeedbackUn accordConfidentialité
logo
© 2022 Selected Technologies LLC – Morgan Hill, California