30
/fr/
AIzaSyAYiBZKx7MnpbEhh9jyipgxe19OcubqV5w
April 1, 2024
45860
Low income
LIC
false
2
1
Antiretroviral therapy coverage (% of people living with HIV)
2016,2015,2014,2013,2012,2011,2010,2009,2008,2007,2006,2005,2004,2003,2002,2001
Download
Bibliothèque de statistiques globales →Low income →

Antiretroviral therapy coverage (% of people living with HIV)

Cette statistique dans les autres pays:

AfghanistanAlgeriaAngolaArab WorldArgentinaArmeniaAustraliaAzerbaijanBahamas, TheBangladeshBarbadosBelarusBelizeBeninBoliviaBotswanaBrazilBurkina FasoBurundiCabo VerdeCambodiaCameroonCaribbean small statesCentral African RepublicChadChileCongo, Dem. Rep.Costa RicaCote d'IvoireCubaDjiboutiDominican RepublicEarly-demographic dividendEcuadorEgypt, Arab Rep.El SalvadorEquatorial GuineaEritreaFragile and conflict affected situationsGabonGambia, TheGeorgiaGhanaGuatemalaGuineaGuyanaHaitiHeavily indebted poor countries (HIPC)HondurasIDA blendIDA onlyIDA totalIndiaIndonesiaIran, Islamic Rep.JamaicaKazakhstanKenyaKyrgyz RepublicLatin America & Caribbean Latin America & Caribbean (excluding high income)Latin America & the Caribbean (IDA & IBRD countries)LatviaLeast developed countries: UN classificationLebanonLesothoLiberiaLow incomeLower middle incomeMadagascarMalawiMalaysiaMaliMauritaniaMauritiusMexicoMiddle East & North AfricaMiddle East & North Africa (excluding high income)Middle East & North Africa (IDA & IBRD countries)MoldovaMongoliaMoroccoMozambiqueMyanmarNamibiaNepalNicaraguaNigerPakistanPanamaPapua New GuineaParaguayPeruPhilippinesPre-demographic dividendRwandaSenegalSierra LeoneSomaliaSouth AfricaSouth AsiaSouth Asia (IDA & IBRD)South SudanSpainSri LankaSub-Saharan Africa Sub-Saharan Africa (excluding high income)Sub-Saharan Africa (IDA & IBRD countries)SudanSurinameSwazilandTajikistanTanzaniaThailandTogoTrinidad and TobagoTunisiaUgandaUkraineUruguayUzbekistanVenezuela, RBVietnamWorldYemen, Rep.ZambiaZimbabwe

La ligne de temps

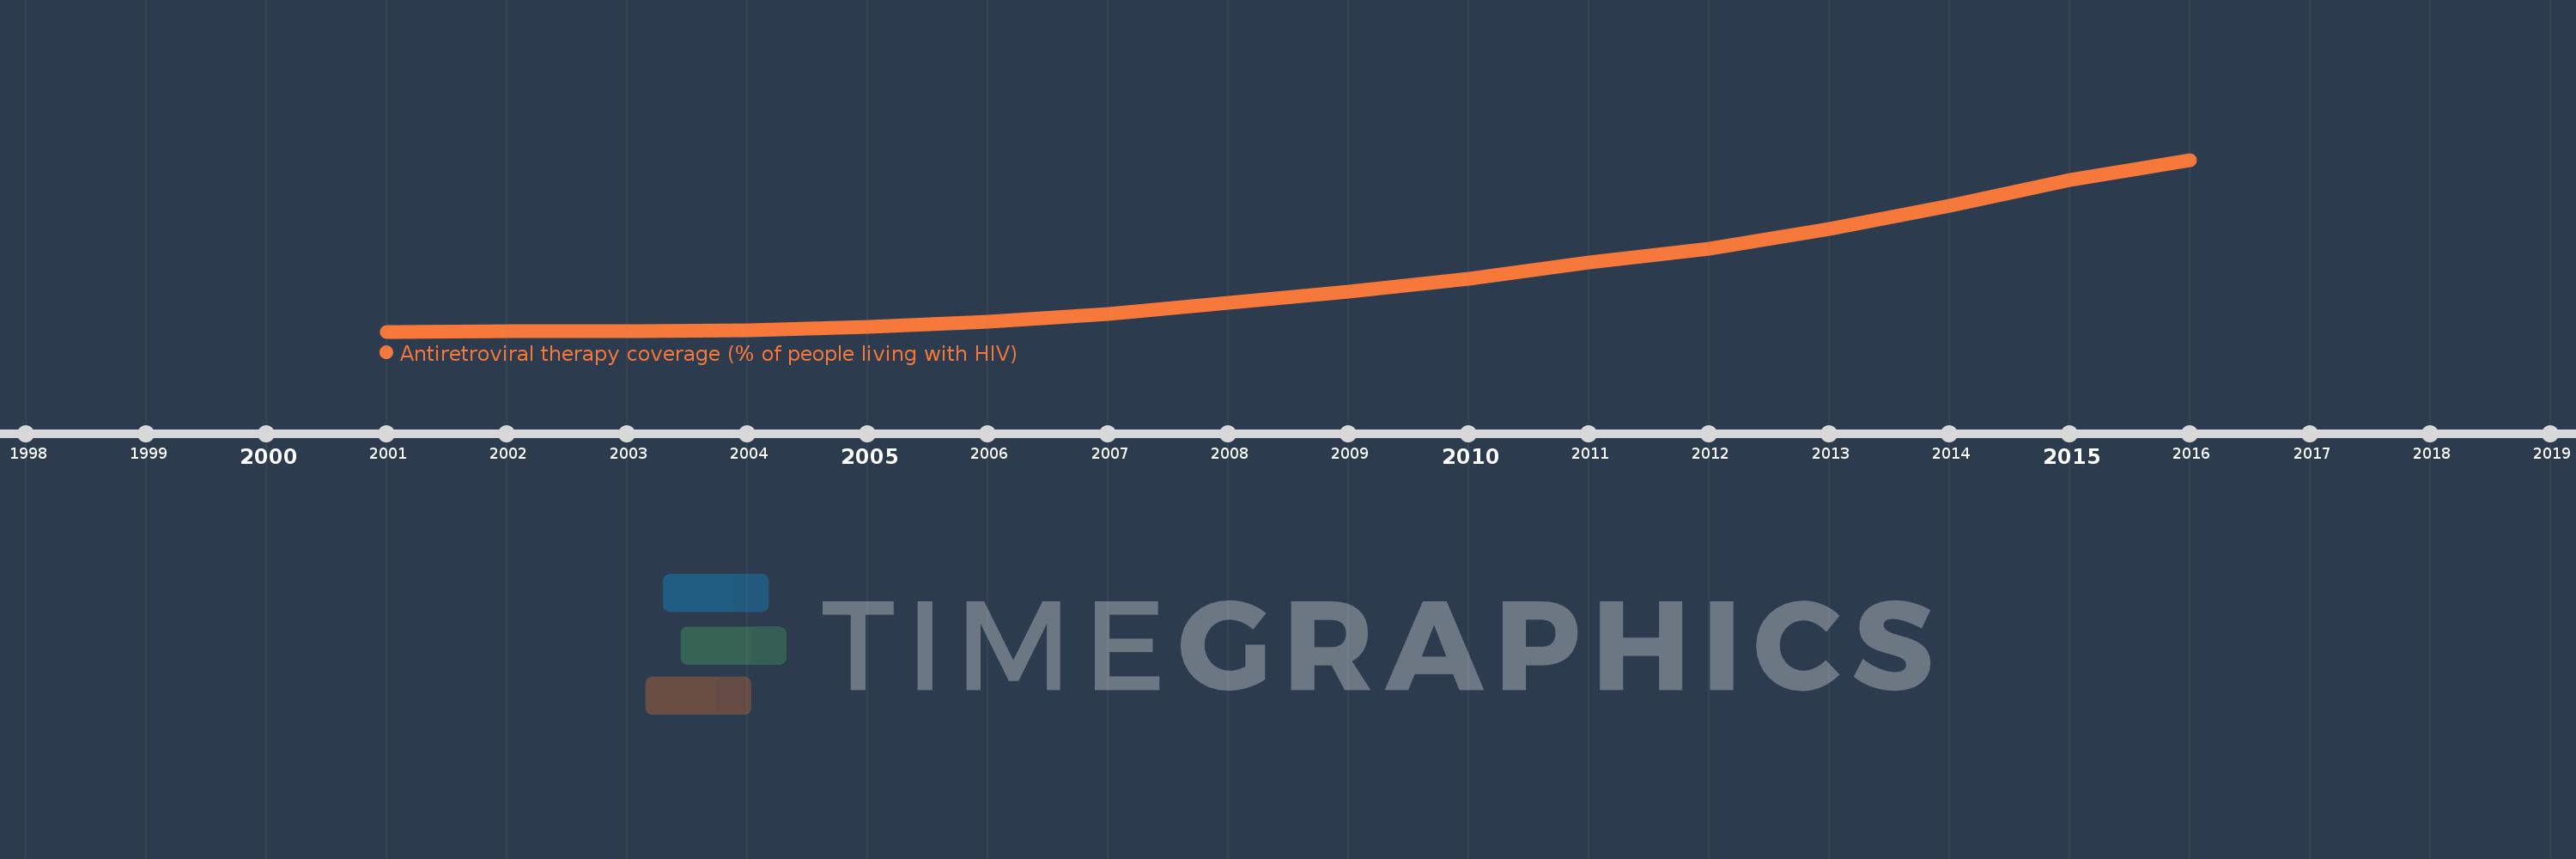
Cette échelle de temps montre un graphique de 2001 année à 2016 année Low income. Les données jusqu'à 2000 année ne sont pas présentés. Quantité d'observations actuelles selon dates: 16.

Source (désignation):

Les indicateurs du développement mondiale

Source (organisation):

UNAIDS estimates.

Catégories:

Health

Dernière mise à jour

23 avr. 2017

Les indicateurs de changement de valeurs selon les années

En moyenne:
16.331
Minimum:
0.0
1 janv. 2001
Maximum:
52.257
1 janv. 2016
Pour la date d''observation
Valeur
Changement absolu
Le changement par rapport à la valeur précédente
1 janv. 2001
0.0
0.0
0.0%
1 janv. 2002
0.137
+0.137
%
1 janv. 2003
0.136
-0.001
-0.89%
1 janv. 2004
0.323
+0.187
137.63%
1 janv. 2005
1.455
+1.132
350.65%
1 janv. 2006
2.98
+1.525
104.86%
1 janv. 2007
5.238
+2.258
75.76%
1 janv. 2008
8.638
+3.4
64.92%
1 janv. 2009
12.141
+3.504
40.56%
1 janv. 2010
16.076
+3.935
32.41%
1 janv. 2011
20.909
+4.833
30.06%
1 janv. 2012
25.248
+4.34
20.75%
1 janv. 2013
31.319
+6.07
24.04%
1 janv. 2014
38.295
+6.976
22.27%
1 janv. 2015
46.14
+7.845
20.49%
1 janv. 2016
52.257
+6.117
13.26%

Classement des pays selon les statistiques actuelles par années