33
/fr/
AIzaSyAYiBZKx7MnpbEhh9jyipgxe19OcubqV5w
August 1, 2025
41236
Latin America & Caribbean
LCN
false
2
1
Antiretroviral therapy coverage (% of people living with HIV)
2016,2015,2014,2013,2012,2011,2010,2009,2008,2007,2006,2005,2004,2003,2002,2001
Download
Bibliothèque de statistiques globales →Latin America & Caribbean  →

Antiretroviral therapy coverage (% of people living with HIV)

Cette statistique dans les autres pays:

AfghanistanAlgeriaAngolaArab WorldArgentinaArmeniaAustraliaAzerbaijanBahamas, TheBangladeshBarbadosBelarusBelizeBeninBoliviaBotswanaBrazilBurkina FasoBurundiCabo VerdeCambodiaCameroonCaribbean small statesCentral African RepublicChadChileCongo, Dem. Rep.Costa RicaCote d'IvoireCubaDjiboutiDominican RepublicEarly-demographic dividendEcuadorEgypt, Arab Rep.El SalvadorEquatorial GuineaEritreaFragile and conflict affected situationsGabonGambia, TheGeorgiaGhanaGuatemalaGuineaGuyanaHaitiHeavily indebted poor countries (HIPC)HondurasIDA blendIDA onlyIDA totalIndiaIndonesiaIran, Islamic Rep.JamaicaKazakhstanKenyaKyrgyz RepublicLatin America & Caribbean Latin America & Caribbean (excluding high income)Latin America & the Caribbean (IDA & IBRD countries)LatviaLeast developed countries: UN classificationLebanonLesothoLiberiaLow incomeLower middle incomeMadagascarMalawiMalaysiaMaliMauritaniaMauritiusMexicoMiddle East & North AfricaMiddle East & North Africa (excluding high income)Middle East & North Africa (IDA & IBRD countries)MoldovaMongoliaMoroccoMozambiqueMyanmarNamibiaNepalNicaraguaNigerPakistanPanamaPapua New GuineaParaguayPeruPhilippinesPre-demographic dividendRwandaSenegalSierra LeoneSomaliaSouth AfricaSouth AsiaSouth Asia (IDA & IBRD)South SudanSpainSri LankaSub-Saharan Africa Sub-Saharan Africa (excluding high income)Sub-Saharan Africa (IDA & IBRD countries)SudanSurinameSwazilandTajikistanTanzaniaThailandTogoTrinidad and TobagoTunisiaUgandaUkraineUruguayUzbekistanVenezuela, RBVietnamWorldYemen, Rep.ZambiaZimbabwe

La ligne de temps

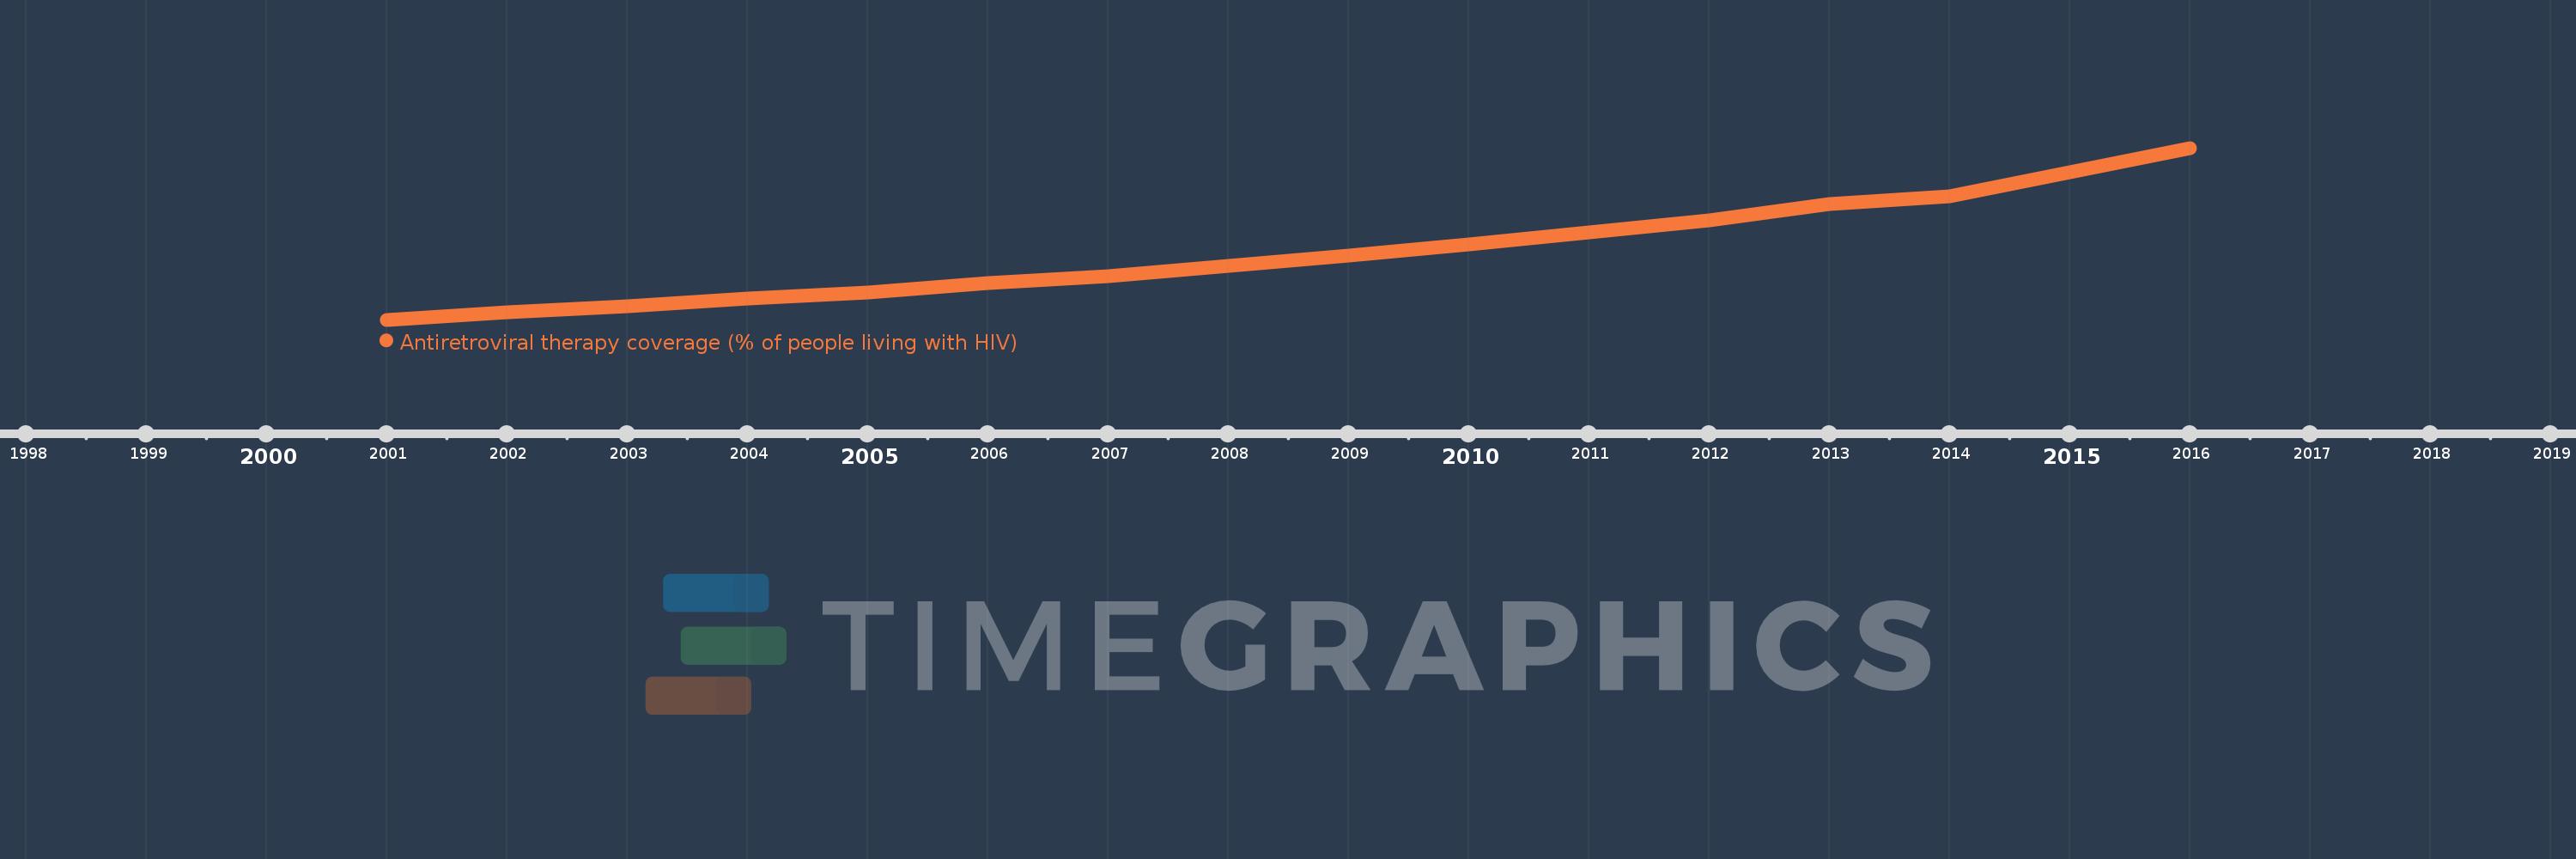
Cette échelle de temps montre un graphique de 2001 année à 2016 année Latin America & Caribbean . Les données jusqu'à 2000 année ne sont pas présentés. Quantité d'observations actuelles selon dates: 16.

Source (désignation):

Les indicateurs du développement mondiale

Source (organisation):

UNAIDS estimates.

Catégories:

Health

Dernière mise à jour

23 avr. 2017

Les indicateurs de changement de valeurs selon les années

En moyenne:
27.378
Minimum:
9.468
1 janv. 2001
Maximum:
54.724
1 janv. 2016
Pour la date d''observation
Valeur
Changement absolu
Le changement par rapport à la valeur précédente
1 janv. 2001
9.468
+9.468
0.0%
1 janv. 2002
11.522
+2.053
21.69%
1 janv. 2003
12.941
+1.42
12.32%
1 janv. 2004
15.106
+2.164
16.72%
1 janv. 2005
16.61
+1.504
9.96%
1 janv. 2006
19.159
+2.549
15.35%
1 janv. 2007
20.911
+1.751
9.14%
1 janv. 2008
23.643
+2.732
13.07%
1 janv. 2009
26.301
+2.658
11.24%
1 janv. 2010
29.367
+3.066
11.66%
1 janv. 2011
32.513
+3.145
10.71%
1 janv. 2012
35.727
+3.214
9.89%
1 janv. 2013
39.853
+4.126
11.55%
1 janv. 2014
41.929
+2.076
5.21%
1 janv. 2015
48.279
+6.35
15.15%
1 janv. 2016
54.724
+6.445
13.35%

Classement des pays selon les statistiques actuelles par années