29
/fr/
fr
AIzaSyAYiBZKx7MnpbEhh9jyipgxe19OcubqV5w
April 1, 2024
230677
Rwanda
RWA
true
2
1
Antiretroviral therapy coverage (% of people living with HIV)
2016,2015,2014,2013,2012,2011,2010,2009,2008,2007,2006,2005,2004,2003,2002,2001
Download
Bibliothèque de statistiques globales →Rwanda →

Antiretroviral therapy coverage (% of people living with HIV)

Cette statistique dans les autres pays:
AfghanistanAlgeriaAngolaArab WorldArgentinaArmeniaAustraliaAzerbaijanBahamas, TheBangladeshBarbadosBelarusBelizeBeninBoliviaBotswanaBrazilBurkina FasoBurundiCabo VerdeCambodiaCameroonCaribbean small statesCentral African RepublicChadChileCongo, Dem. Rep.Costa RicaCote d'IvoireCubaDjiboutiDominican RepublicEarly-demographic dividendEcuadorEgypt, Arab Rep.El SalvadorEquatorial GuineaEritreaFragile and conflict affected situationsGabonGambia, TheGeorgiaGhanaGuatemalaGuineaGuyanaHaitiHeavily indebted poor countries (HIPC)HondurasIDA blendIDA onlyIDA totalIndiaIndonesiaIran, Islamic Rep.JamaicaKazakhstanKenyaKyrgyz RepublicLatin America & Caribbean Latin America & Caribbean (excluding high income)Latin America & the Caribbean (IDA & IBRD countries)LatviaLeast developed countries: UN classificationLebanonLesothoLiberiaLow incomeLower middle incomeMadagascarMalawiMalaysiaMaliMauritaniaMauritiusMexicoMiddle East & North AfricaMiddle East & North Africa (excluding high income)Middle East & North Africa (IDA & IBRD countries)MoldovaMongoliaMoroccoMozambiqueMyanmarNamibiaNepalNicaraguaNigerPakistanPanamaPapua New GuineaParaguayPeruPhilippinesPre-demographic dividendRwandaSenegalSierra LeoneSomaliaSouth AfricaSouth AsiaSouth Asia (IDA & IBRD)South SudanSpainSri LankaSub-Saharan Africa Sub-Saharan Africa (excluding high income)Sub-Saharan Africa (IDA & IBRD countries)SudanSurinameSwazilandTajikistanTanzaniaThailandTogoTrinidad and TobagoTunisiaUgandaUkraineUruguayUzbekistanVenezuela, RBVietnamWorldYemen, Rep.ZambiaZimbabwe
La ligne de temps
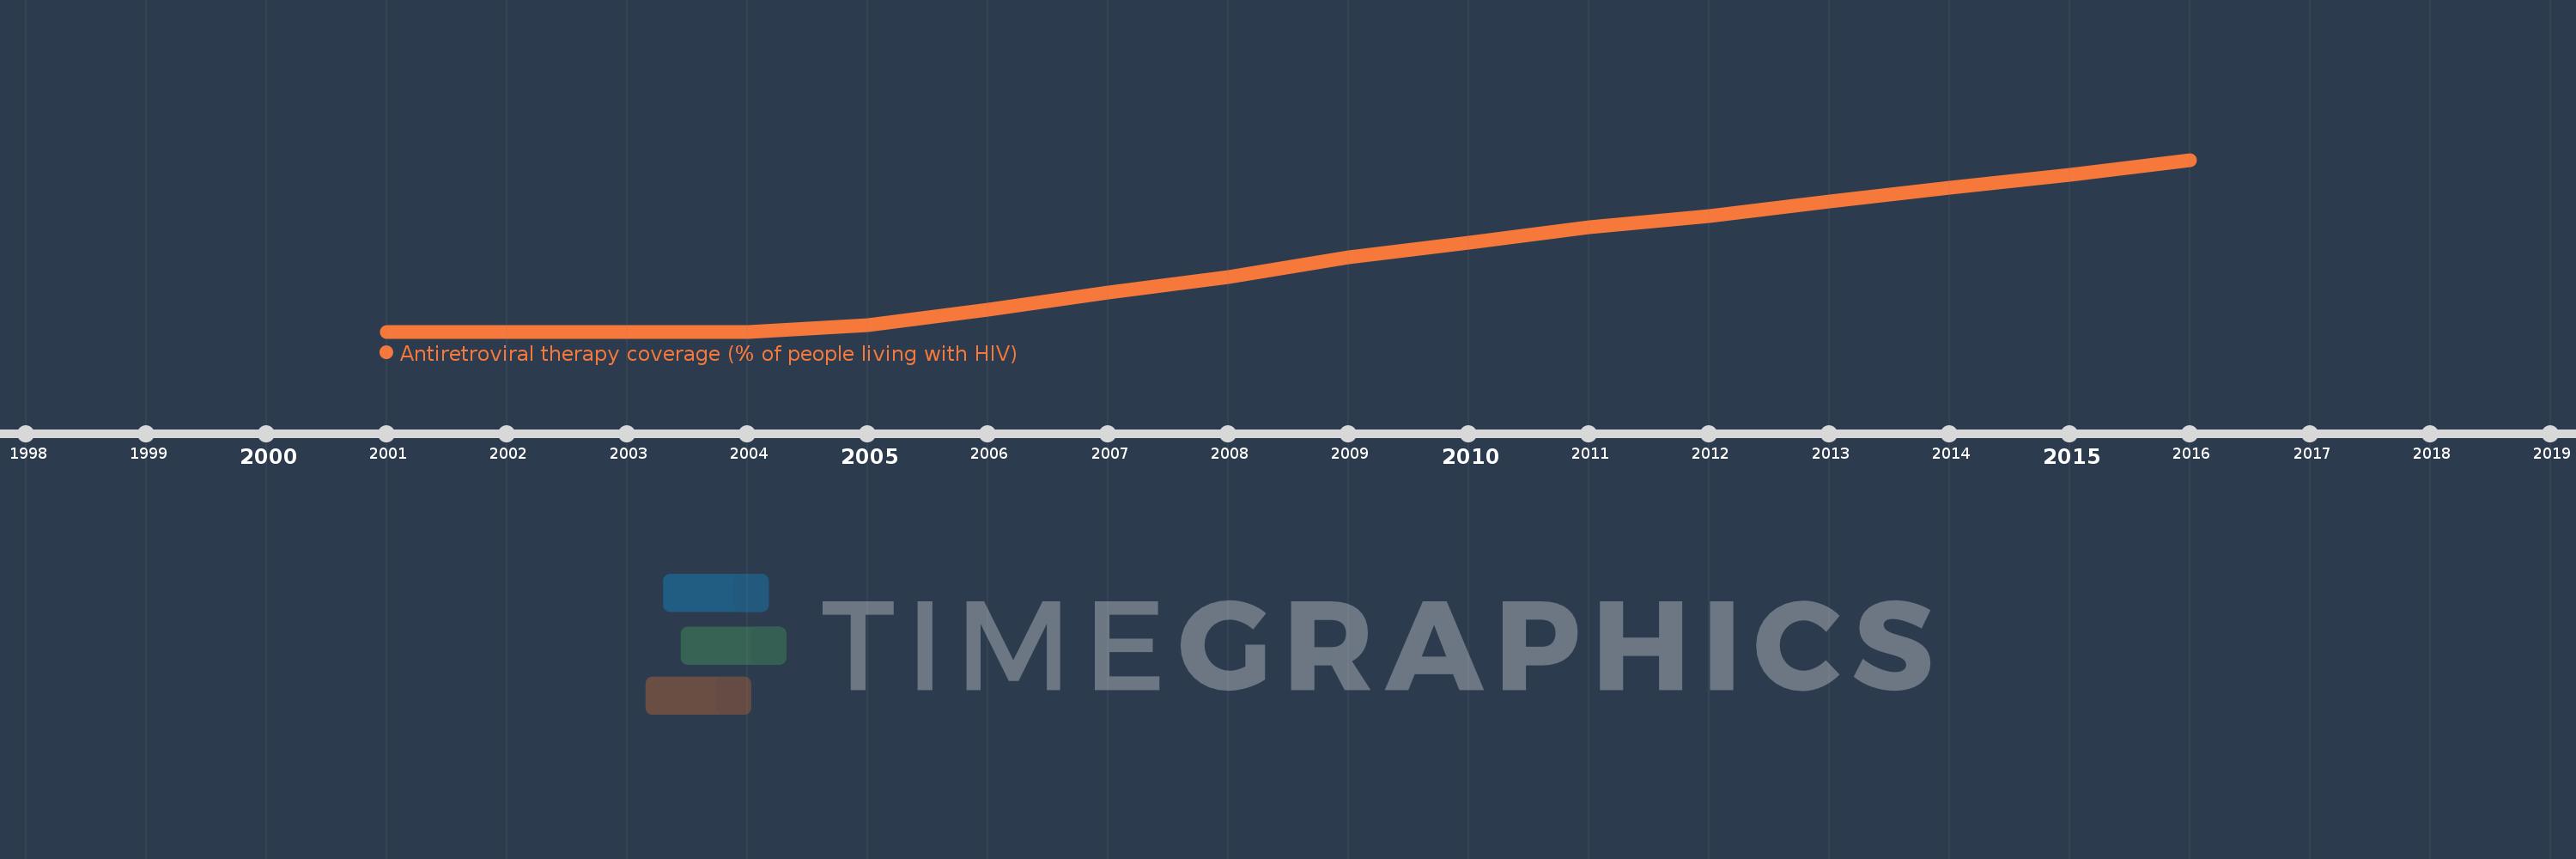
Cette échelle de temps montre un graphique de 2001 année à 2016 année Rwanda. Les données jusqu'à 2000 année ne sont pas présentés. Quantité d'observations actuelles selon dates: 16.
Source (désignation):
Les indicateurs du développement mondiale
Source (organisation):
UNAIDS estimates.
Catégories:
Health
Dernière mise à jour
23 avr. 2017
Les indicateurs de changement de valeurs selon les années
En moyenne:
31.813
Minimum:
0.0
1 janv. 2001
Maximum:
79.0
1 janv. 2016
Pour la date d''observation
Valeur
Changement absolu
Le changement par rapport à la valeur précédente
1 janv. 2001
0.0
0.0
0.0%
1 janv. 2002
0.0
0.0
%
1 janv. 2003
0.0
0.0
%
1 janv. 2004
0.0
0.0
%
1 janv. 2005
3.0
+3.0
%
1 janv. 2006
10.0
+7.0
233.33%
1 janv. 2007
18.0
+8.0
80.0%
1 janv. 2008
25.0
+7.0
38.89%
1 janv. 2009
34.0
+9.0
36.0%
1 janv. 2010
41.0
+7.0
20.59%
1 janv. 2011
48.0
+7.0
17.07%
1 janv. 2012
53.0
+5.0
10.42%
1 janv. 2013
60.0
+7.0
13.21%
1 janv. 2014
66.0
+6.0
10.0%
1 janv. 2015
72.0
+6.0
9.09%
1 janv. 2016
79.0
+7.0
9.72%
Classement des pays selon les statistiques actuelles par années

Commentaires:

Envoyer
PremiumAbout & FeedbackUn accordConfidentialité
logo
© 2022 Selected Technologies LLC – Morgan Hill, California