30
/fr/
AIzaSyAYiBZKx7MnpbEhh9jyipgxe19OcubqV5w
April 1, 2024
37951
IDA blend
IDB
false
2
1
Antiretroviral therapy coverage (% of people living with HIV)
2016,2015,2014,2013,2012,2011,2010,2009,2008,2007,2006,2005,2004,2003,2002,2001
Download
Bibliothèque de statistiques globales →IDA blend →

Antiretroviral therapy coverage (% of people living with HIV)

Cette statistique dans les autres pays:

AfghanistanAlgeriaAngolaArab WorldArgentinaArmeniaAustraliaAzerbaijanBahamas, TheBangladeshBarbadosBelarusBelizeBeninBoliviaBotswanaBrazilBurkina FasoBurundiCabo VerdeCambodiaCameroonCaribbean small statesCentral African RepublicChadChileCongo, Dem. Rep.Costa RicaCote d'IvoireCubaDjiboutiDominican RepublicEarly-demographic dividendEcuadorEgypt, Arab Rep.El SalvadorEquatorial GuineaEritreaFragile and conflict affected situationsGabonGambia, TheGeorgiaGhanaGuatemalaGuineaGuyanaHaitiHeavily indebted poor countries (HIPC)HondurasIDA blendIDA onlyIDA totalIndiaIndonesiaIran, Islamic Rep.JamaicaKazakhstanKenyaKyrgyz RepublicLatin America & Caribbean Latin America & Caribbean (excluding high income)Latin America & the Caribbean (IDA & IBRD countries)LatviaLeast developed countries: UN classificationLebanonLesothoLiberiaLow incomeLower middle incomeMadagascarMalawiMalaysiaMaliMauritaniaMauritiusMexicoMiddle East & North AfricaMiddle East & North Africa (excluding high income)Middle East & North Africa (IDA & IBRD countries)MoldovaMongoliaMoroccoMozambiqueMyanmarNamibiaNepalNicaraguaNigerPakistanPanamaPapua New GuineaParaguayPeruPhilippinesPre-demographic dividendRwandaSenegalSierra LeoneSomaliaSouth AfricaSouth AsiaSouth Asia (IDA & IBRD)South SudanSpainSri LankaSub-Saharan Africa Sub-Saharan Africa (excluding high income)Sub-Saharan Africa (IDA & IBRD countries)SudanSurinameSwazilandTajikistanTanzaniaThailandTogoTrinidad and TobagoTunisiaUgandaUkraineUruguayUzbekistanVenezuela, RBVietnamWorldYemen, Rep.ZambiaZimbabwe

La ligne de temps

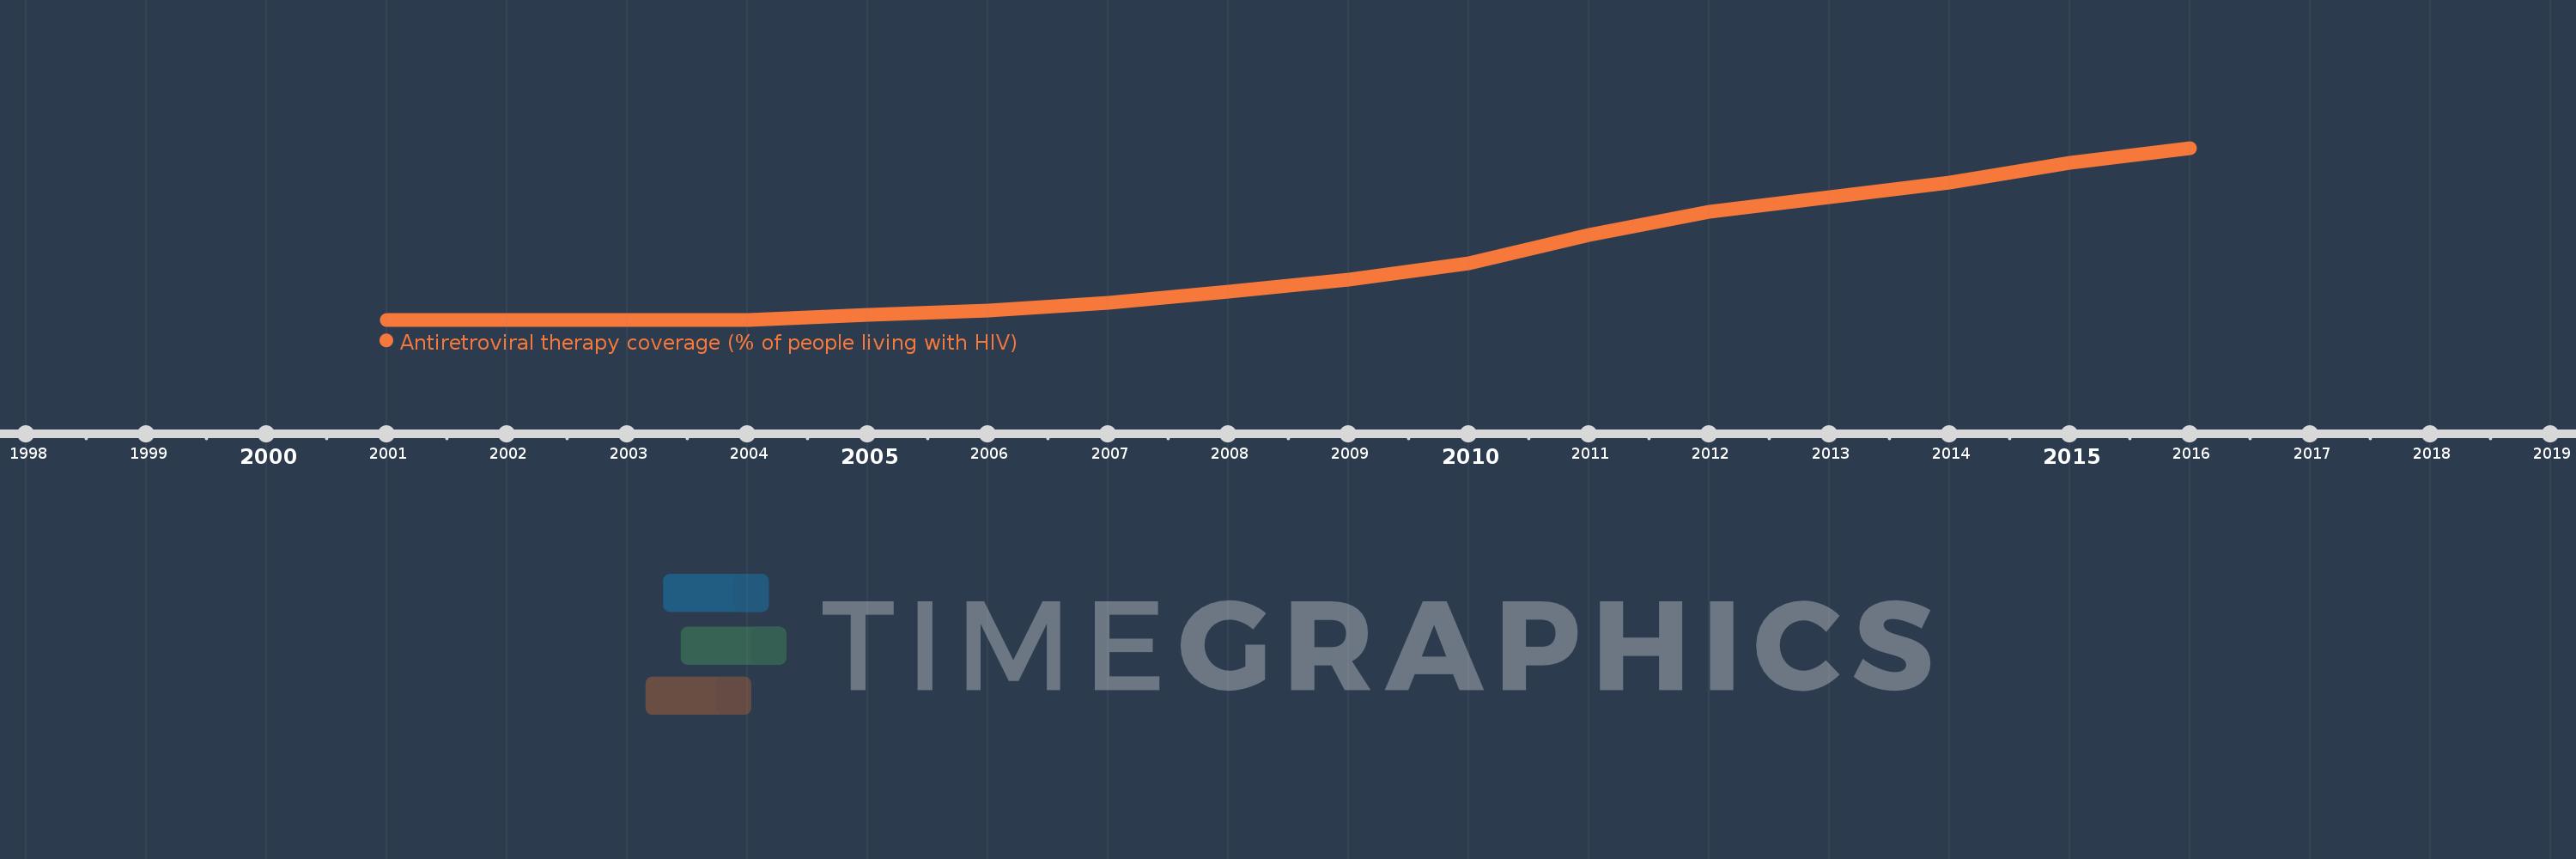
Cette échelle de temps montre un graphique de 2001 année à 2016 année IDA blend. Les données jusqu'à 2000 année ne sont pas présentés. Quantité d'observations actuelles selon dates: 16.

Source (désignation):

Les indicateurs du développement mondiale

Source (organisation):

UNAIDS estimates.

Catégories:

Health

Dernière mise à jour

23 avr. 2017

Les indicateurs de changement de valeurs selon les années

En moyenne:
16.324
Minimum:
0.0
1 janv. 2001
Maximum:
47.912
1 janv. 2016
Pour la date d''observation
Valeur
Changement absolu
Le changement par rapport à la valeur précédente
1 janv. 2001
0.0
0.0
0.0%
1 janv. 2002
0.0
0.0
%
1 janv. 2003
0.0
0.0
%
1 janv. 2004
0.006
+0.006
%
1 janv. 2005
1.339
+1.333
21.12 milles%
1 janv. 2006
2.559
+1.22
91.05%
1 janv. 2007
4.688
+2.13
83.22%
1 janv. 2008
7.731
+3.042
64.89%
1 janv. 2009
11.298
+3.567
46.14%
1 janv. 2010
15.764
+4.467
39.54%
1 janv. 2011
23.69
+7.925
50.27%
1 janv. 2012
30.03
+6.34
26.76%
1 janv. 2013
34.186
+4.156
13.84%
1 janv. 2014
38.231
+4.045
11.83%
1 janv. 2015
43.754
+5.524
14.45%
1 janv. 2016
47.912
+4.158
9.5%

Classement des pays selon les statistiques actuelles par années