33
/fr/
AIzaSyB4mHJ5NPEv-XzF7P6NDYXjlkCWaeKw5bc
November 1, 2025
34040
Fragile and conflict affected situations
FCS
false
2
1
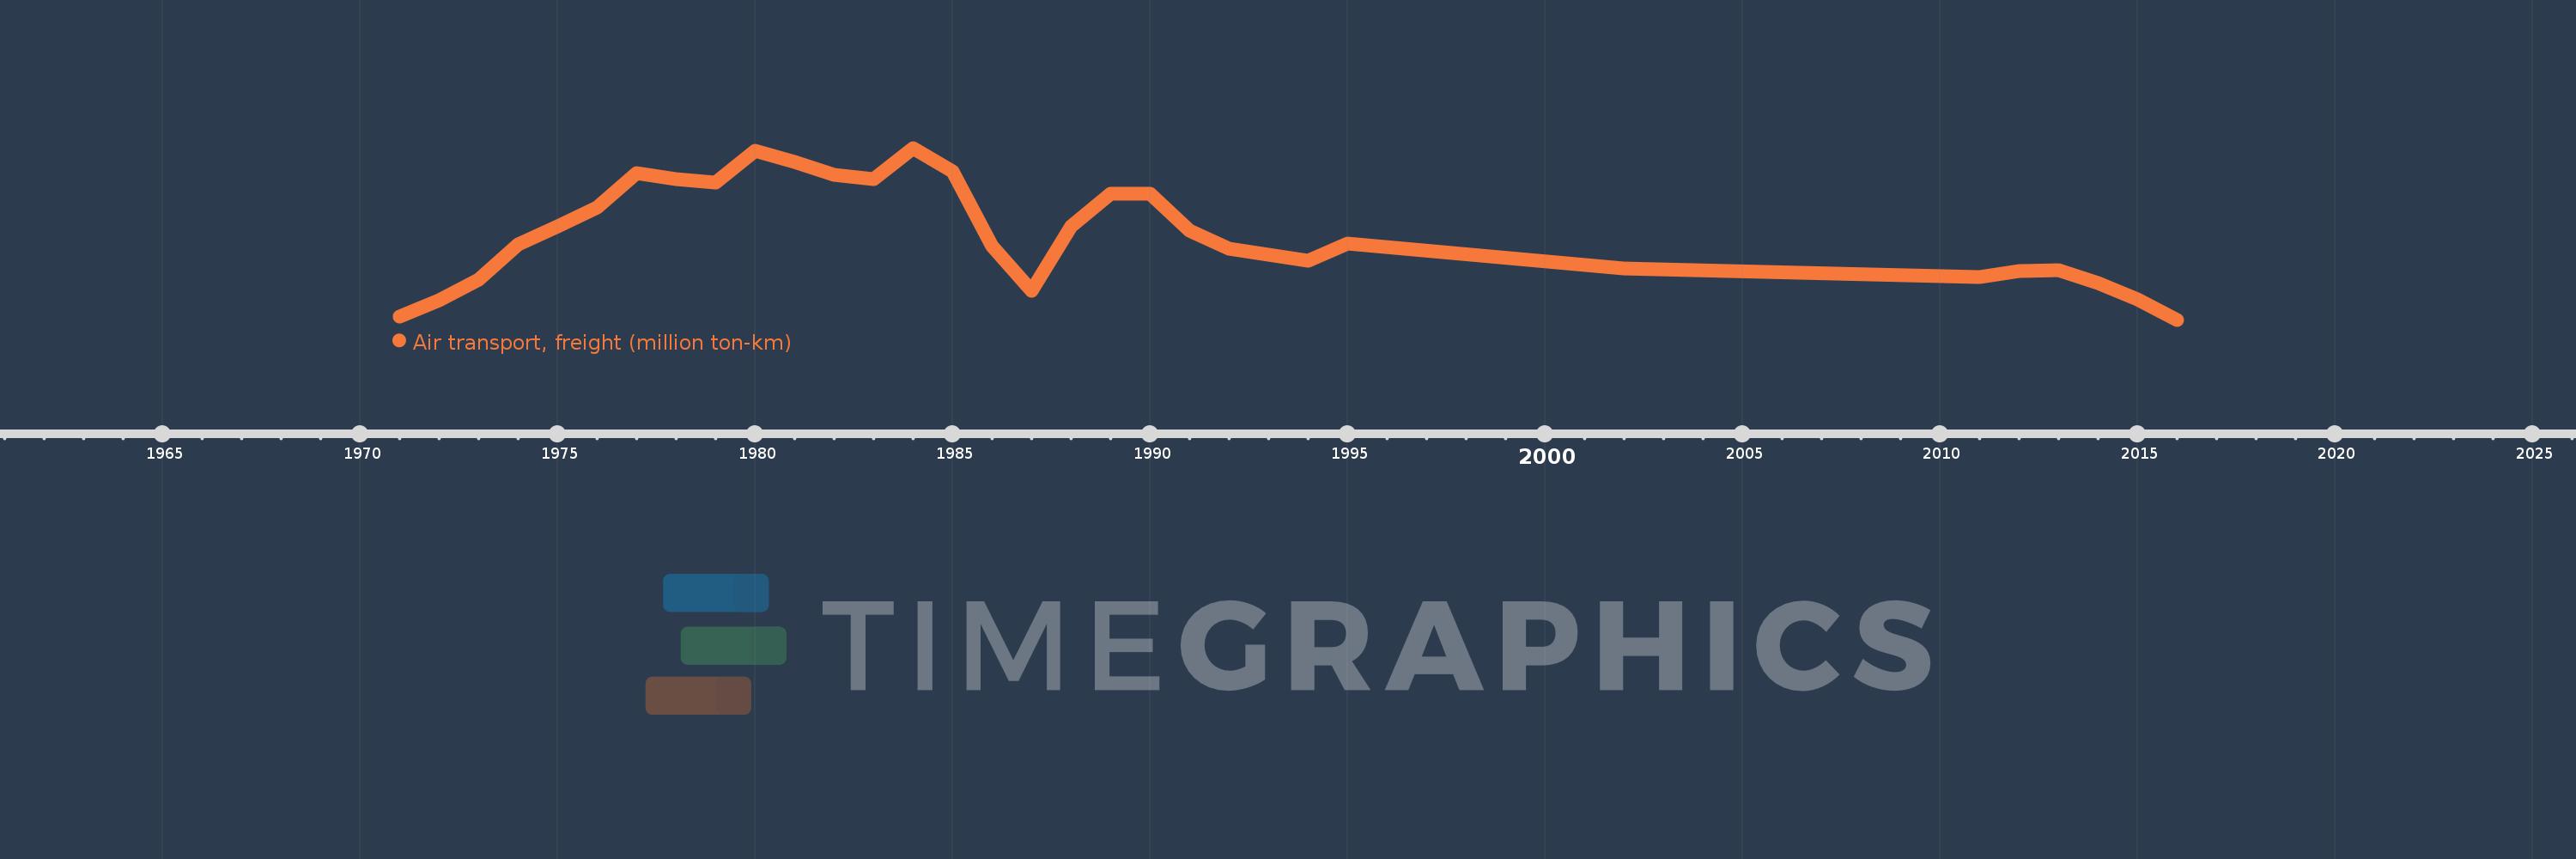
Air transport, freight (million ton-km)
2016,2015,2014,2013,2012,2011,2002,1995,1994,1993,1992,1991,1990,1989,1988,1987,1986,1985,1984,1983,1982,1981,1980,1979,1978,1977,1976,1975,1974,1973,1972,1971