30
/fr/
AIzaSyAYiBZKx7MnpbEhh9jyipgxe19OcubqV5w
April 1, 2024
277786
Uruguay
URY
true
2
1
ICT service exports (BoP, current US$)
2016,2015,2014,2013,2012,2011,2010,2009,2008,2007,2006,2005,2004,2003,2002,2001,2000,1999,1998,1997,1996
Download
Bibliothèque de statistiques globales →Uruguay →

ICT service exports (BoP, current US$)

Cette statistique dans les autres pays:

AfghanistanAlbaniaAlgeriaAngolaAntigua and BarbudaArab WorldArgentinaArmeniaArubaAustraliaAustriaAzerbaijanBahrainBangladeshBarbadosBelarusBelgiumBelizeBeninBermudaBhutanBoliviaBosnia and HerzegovinaBotswanaBrazilBrunei DarussalamBulgariaBurkina FasoBurundiCabo VerdeCambodiaCameroonCanadaCaribbean small statesCentral Europe and the BalticsChileChinaColombiaComorosCongo, Dem. Rep.Congo, Rep.Costa RicaCote d'IvoireCroatiaCuracaoCyprusCzech RepublicDenmarkDjiboutiDominicaDominican RepublicEarly-demographic dividendEast Asia & PacificEast Asia & Pacific (excluding high income)East Asia & Pacific (IDA & IBRD countries)EcuadorEgypt, Arab Rep.El SalvadorEritreaEstoniaEthiopiaEuro areaEurope & Central AsiaEurope & Central Asia (excluding high income)Europe & Central Asia (IDA & IBRD countries)European UnionFaroe IslandsFijiFinlandFragile and conflict affected situationsFranceFrench PolynesiaGabonGambia, TheGeorgiaGermanyGreeceGrenadaGuatemalaGuineaGuinea-BissauGuyanaHeavily indebted poor countries (HIPC)High incomeHondurasHong Kong SAR, ChinaHungaryIBRD onlyIcelandIDA & IBRD totalIDA blendIDA onlyIDA totalIndiaIndonesiaIraqIrelandIsraelItalyJamaicaJapanJordanKazakhstanKenyaKorea, Rep.KosovoKuwaitKyrgyz RepublicLao PDRLate-demographic dividendLatin America & Caribbean Latin America & Caribbean (excluding high income)Latin America & the Caribbean (IDA & IBRD countries)LatviaLeast developed countries: UN classificationLebanonLesothoLithuaniaLow & middle incomeLow incomeLower middle incomeLuxembourgMacao SAR, ChinaMacedonia, FYRMadagascarMalawiMalaysiaMaliMaltaMauritaniaMauritiusMexicoMicronesia, Fed. Sts.Middle East & North AfricaMiddle East & North Africa (excluding high income)Middle East & North Africa (IDA & IBRD countries)Middle incomeMoldovaMongoliaMontenegroMoroccoMozambiqueMyanmarNamibiaNepalNetherlandsNew CaledoniaNew ZealandNicaraguaNigerNigeriaNorth AmericaNorwayOECD membersOmanPacific island small statesPakistanPalauPanamaPapua New GuineaParaguayPeruPhilippinesPolandPortugalPost-demographic dividendPre-demographic dividendRomaniaRussian FederationRwandaSamoaSao Tome and PrincipeSaudi ArabiaSenegalSerbiaSeychellesSierra LeoneSingaporeSint Maarten (Dutch part)Slovak RepublicSloveniaSmall statesSolomon IslandsSouth AfricaSouth AsiaSouth Asia (IDA & IBRD)South SudanSpainSri LankaSt. Kitts and NevisSt. LuciaSt. Vincent and the GrenadinesSub-Saharan Africa Sub-Saharan Africa (excluding high income)Sub-Saharan Africa (IDA & IBRD countries)SudanSurinameSwazilandSwedenSwitzerlandSyrian Arab RepublicTajikistanTanzaniaThailandTogoTongaTrinidad and TobagoTunisiaTurkeyTuvaluUgandaUkraineUnited KingdomUnited StatesUpper middle incomeUruguayVanuatuVenezuela, RBWest Bank and GazaWorldYemen, Rep.ZambiaZimbabwe

La ligne de temps

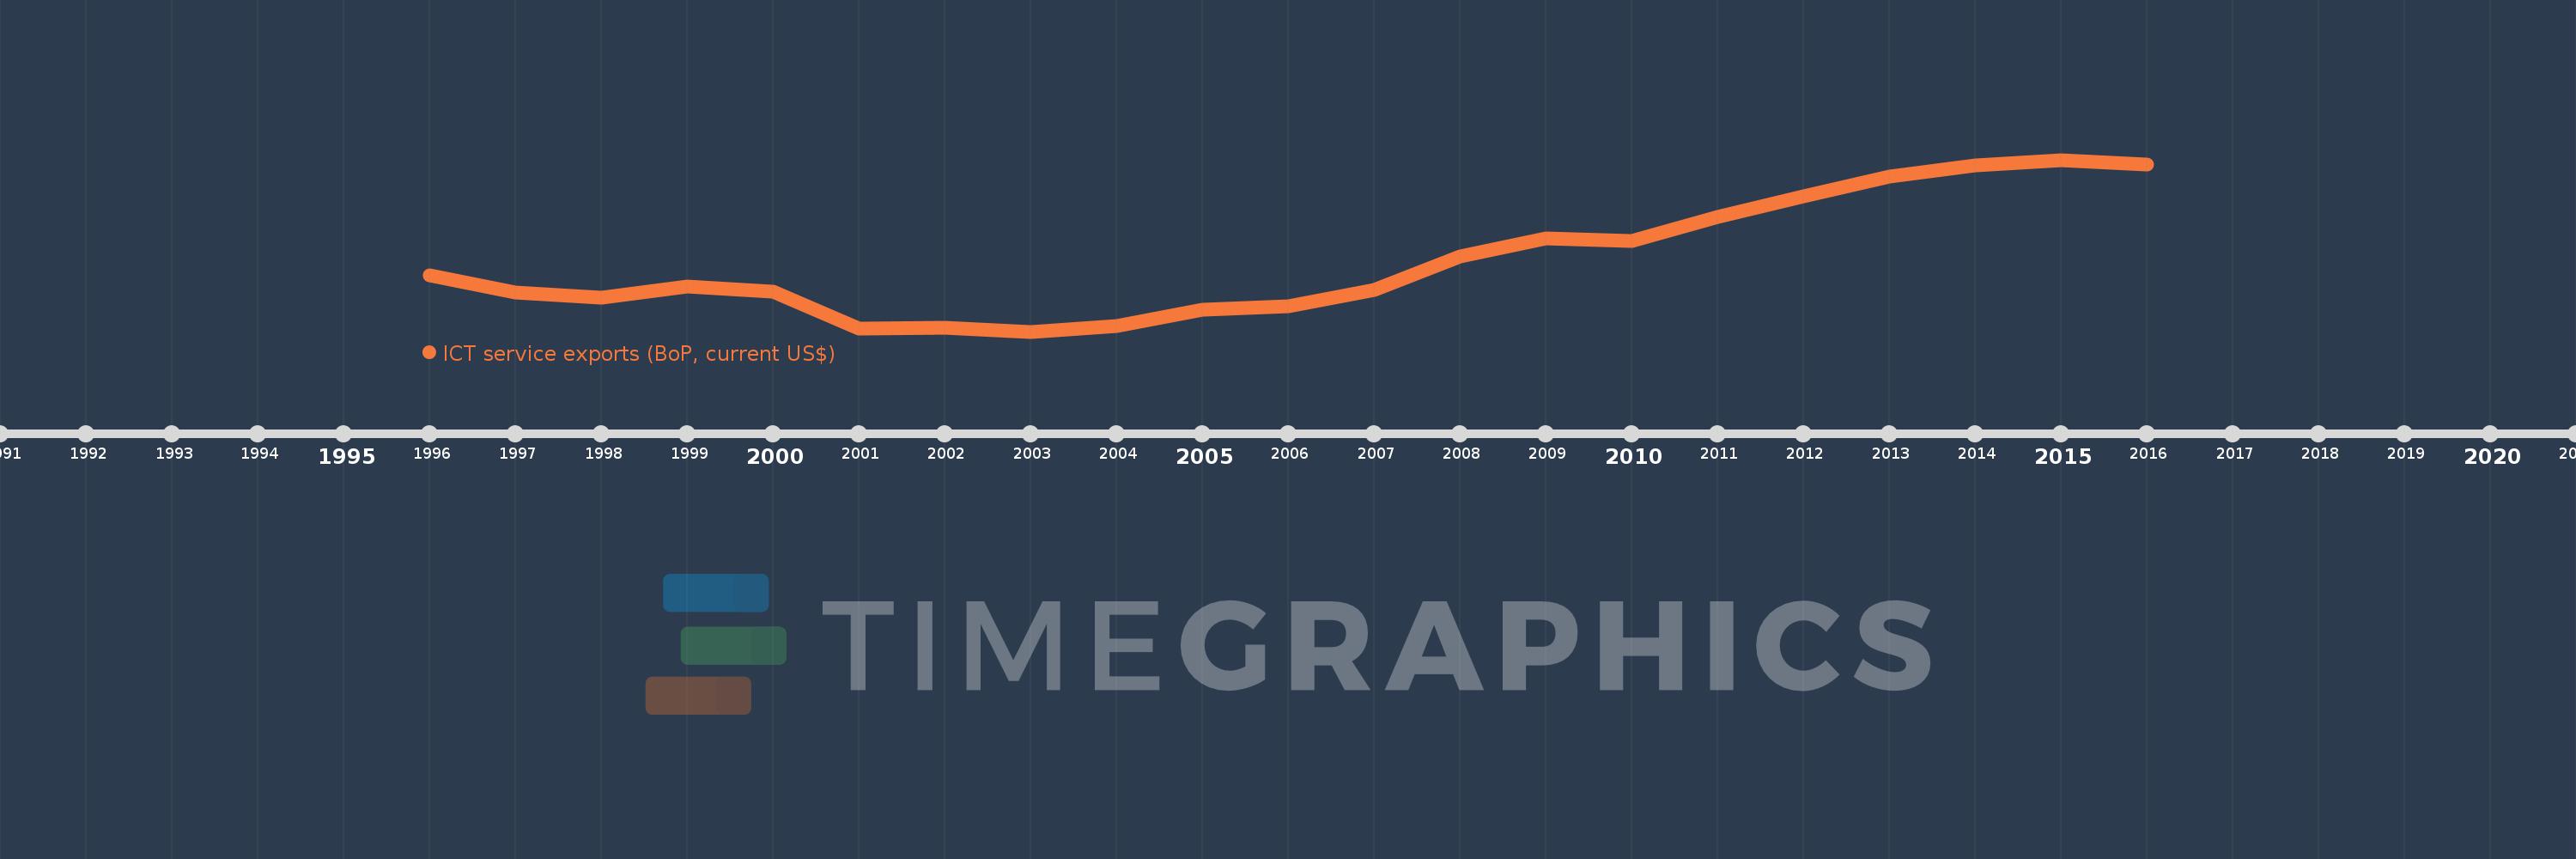
Cette échelle de temps montre un graphique de 1996 année à 2016 année Uruguay. Les données jusqu'à 1995 année ne sont pas présentés. Quantité d'observations actuelles selon dates: 21.

Source (désignation):

Les indicateurs du développement mondiale

Source (organisation):

International Monetary Fund, Balance of Payments Statistics Yearbook and data files.

Catégories:

Economy & Growth, Infrastructure, Trade

Dernière mise à jour

23 avr. 2017

Les indicateurs de changement de valeurs selon les années

En moyenne:
337.59 mln.
Minimum:
49.794 mln.
1 janv. 2003
Maximum:
748.721 mln.
1 janv. 2015
Pour la date d''observation
Valeur
Changement absolu
Le changement par rapport à la valeur précédente
1 janv. 1996
279.4 mln.
+279.4 mln.
0.0%
1 janv. 1997
210.5 mln.
-68.9 mln.
-24.66%
1 janv. 1998
188.8 mln.
-21.7 mln.
-10.31%
1 janv. 1999
234.7 mln.
+45.9 mln.
24.31%
1 janv. 2000
213.1 mln.
-21.6 mln.
-9.2%
1 janv. 2001
61.93 mln.
-151.17 mln.
-70.94%
1 janv. 2002
66.64 mln.
+4.71 mln.
7.61%
1 janv. 2003
49.794 mln.
-16.846 mln.
-25.28%
1 janv. 2004
73.504 mln.
+23.71 mln.
47.62%
1 janv. 2005
139.601 mln.
+66.097 mln.
89.92%
1 janv. 2006
151.921 mln.
+12.32 mln.
8.83%
1 janv. 2007
218.263 mln.
+66.342 mln.
43.67%
1 janv. 2008
355.493 mln.
+137.23 mln.
62.87%
1 janv. 2009
428.618 mln.
+73.125 mln.
20.57%
1 janv. 2010
417.703 mln.
-10.915 mln.
-2.55%
1 janv. 2011
514.722 mln.
+97.019 mln.
23.23%
1 janv. 2012
601.062 mln.
+86.34 mln.
16.77%
1 janv. 2013
679.869 mln.
+78.806 mln.
13.11%
1 janv. 2014
725.926 mln.
+46.057 mln.
6.77%
1 janv. 2015
748.721 mln.
+22.795 mln.
3.14%
1 janv. 2016
729.113 mln.
-19.608 mln.
-2.62%

Classement des pays selon les statistiques actuelles par années