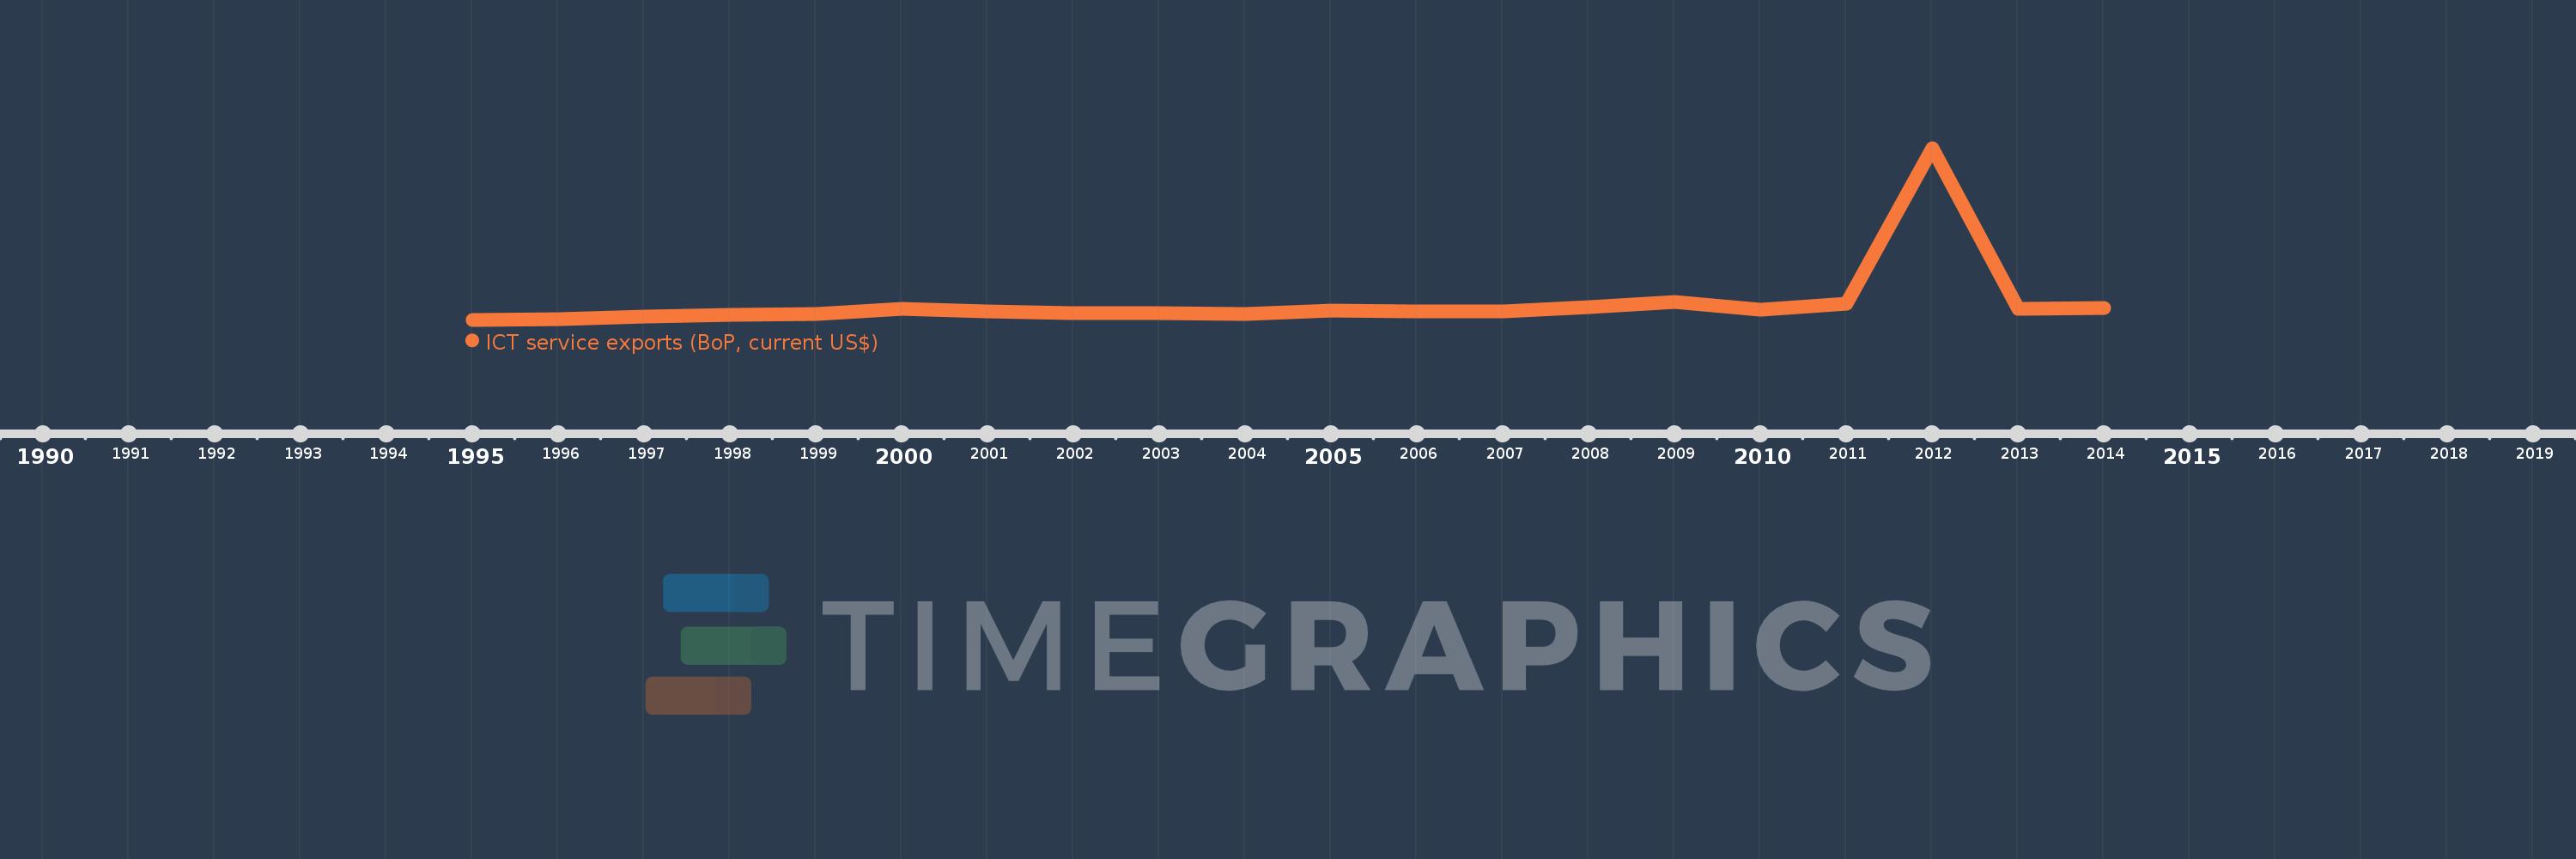
Cette échelle de temps montre un graphique de 1995 année à 2014 année Caribbean small states. Les données jusqu'à 1994 année ne sont pas présentés. Quantité d'observations actuelles selon dates: 20.
Source (désignation):
Les indicateurs du développement mondiale
Source (organisation):
International Monetary Fund, Balance of Payments Statistics Yearbook and data files.
Catégories:
Economy & Growth, Infrastructure, Trade
Dernière mise à jour
23 avr. 2017
Les indicateurs de changement de valeurs selon les années
En moyenne:
1.011 mds
Minimum:
512.104 mln.
1 janv. 1995
Maximum:
5.735 mds
1 janv. 2012
Pour la date d''observation
Valeur
Changement absolu
Le changement par rapport à la valeur précédente
1 janv. 1995
512.104 mln.
+512.104 mln.
0.0%
1 janv. 1996
521.094 mln.
+8.99 mln.
1.76%
1 janv. 1997
596.916 mln.
+75.822 mln.
14.55%
1 janv. 1998
649.964 mln.
+53.048 mln.
8.89%
1 janv. 1999
683.834 mln.
+33.87 mln.
5.21%
1 janv. 2000
850.618 mln.
+166.783 mln.
24.39%
1 janv. 2001
766.862 mln.
-83.756 mln.
-9.85%
1 janv. 2002
713.474 mln.
-53.388 mln.
-6.96%
1 janv. 2003
702.79 mln.
-10.684 mln.
-1.5%
1 janv. 2004
678.774 mln.
-24.015 mln.
-3.42%
1 janv. 2005
794.677 mln.
+115.903 mln.
17.08%
1 janv. 2006
768.092 mln.
-26.585 mln.
-3.35%
1 janv. 2007
772.969 mln.
+4.877 mln.
0.64%
1 janv. 2008
903.698 mln.
+130.729 mln.
16.91%
1 janv. 2009
1.063 mds
+158.854 mln.
17.58%
1 janv. 2010
815.99 mln.
-246.562 mln.
-23.2%
1 janv. 2011
991.651 mln.
+175.661 mln.
21.53%
1 janv. 2012
5.735 mds
+4.744 mds
478.38%
1 janv. 2013
837.602 mln.
-4.898 mds
-85.4%
1 janv. 2014
857.576 mln.
+19.974 mln.
2.38%
Classement des pays selon les statistiques actuelles par années