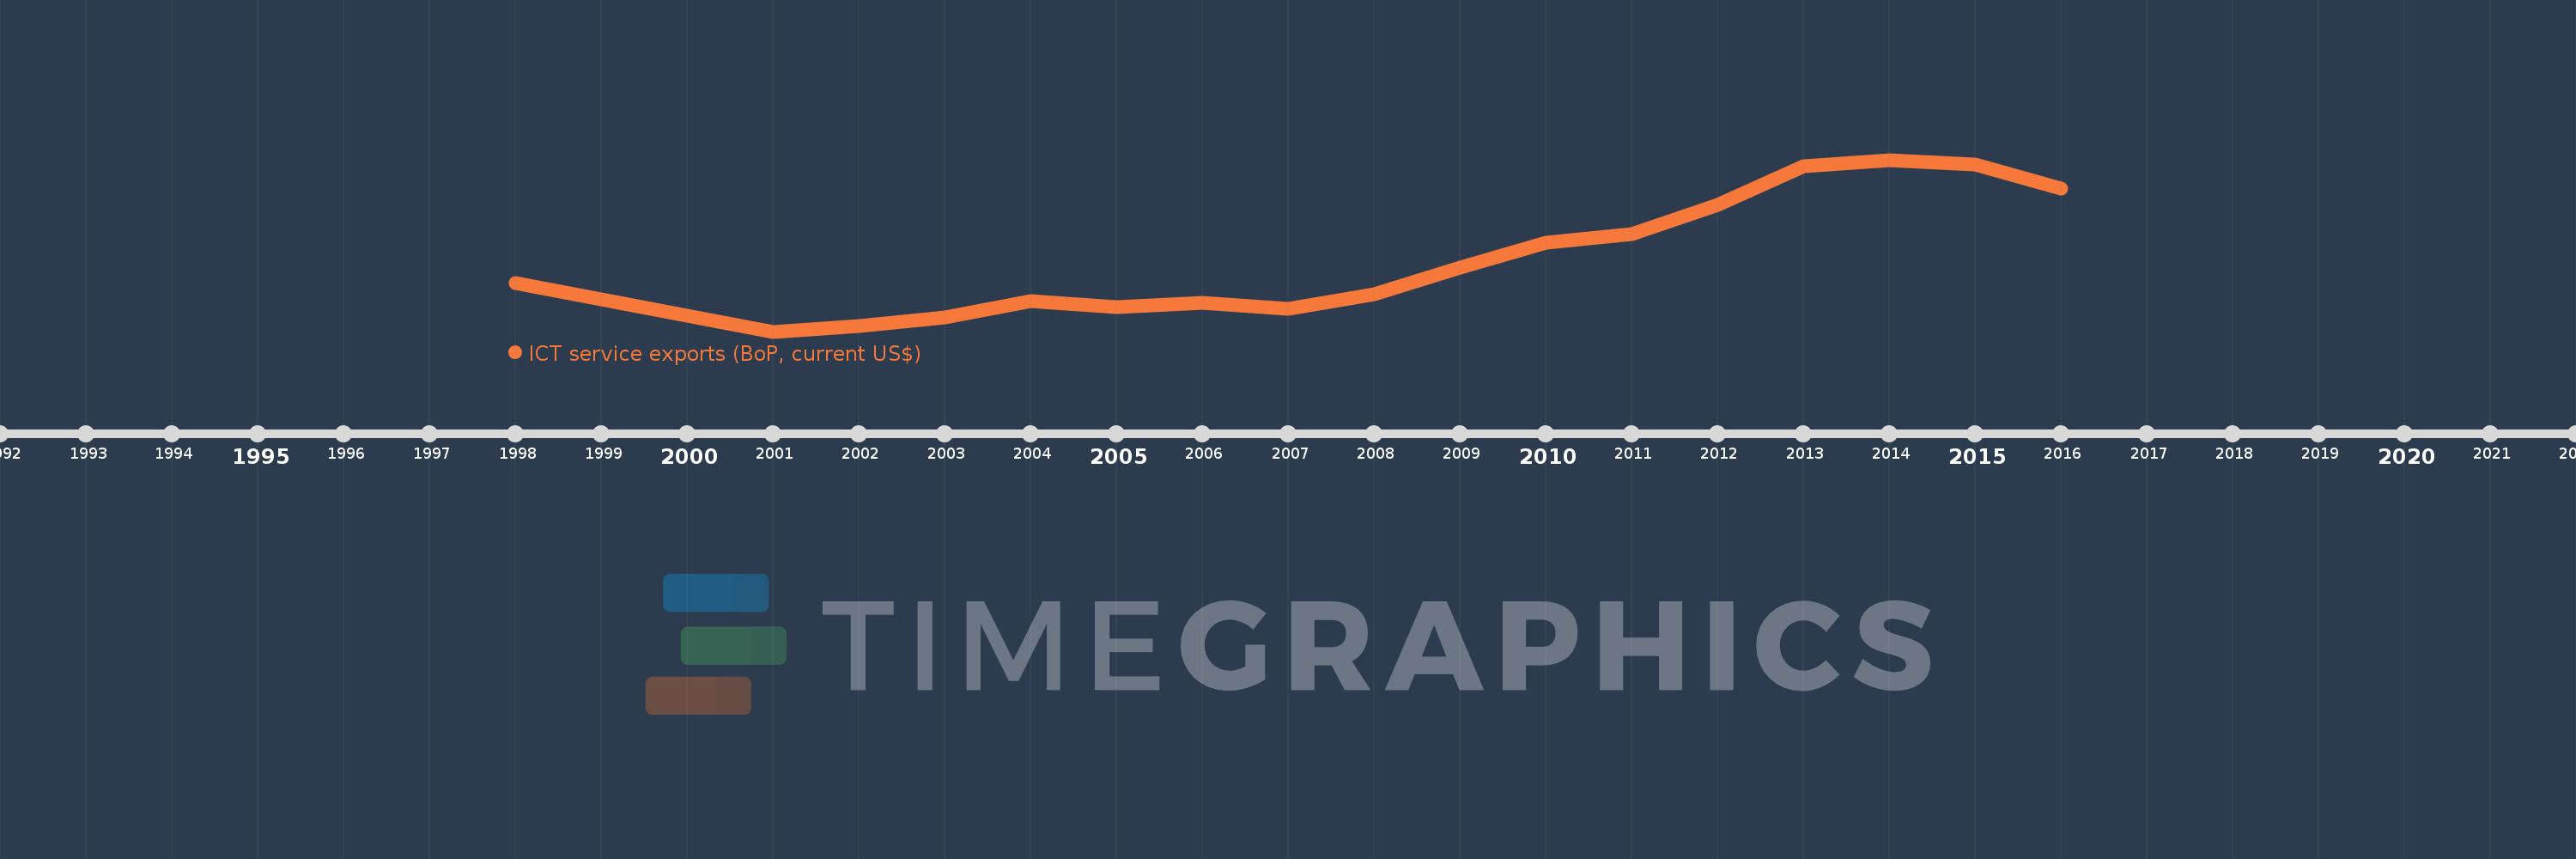
Cette échelle de temps montre un graphique de 1998 année à 2016 année Georgia. Les données jusqu'à 1997 année ne sont pas présentés. Quantité d'observations actuelles selon dates: 17.
Source (désignation):
Les indicateurs du développement mondiale
Source (organisation):
International Monetary Fund, Balance of Payments Statistics Yearbook and data files.
Catégories:
Economy & Growth, Infrastructure, Trade
Dernière mise à jour
23 avr. 2017
Les indicateurs de changement de valeurs selon les années
En moyenne:
58.002 mln.
Minimum:
10.997 mln.
1 janv. 2001
Maximum:
122.079 mln.
1 janv. 2014
Pour la date d''observation
Valeur
Changement absolu
Le changement par rapport à la valeur précédente
1 janv. 1998
42.2 mln.
+42.2 mln.
0.0%
1 janv. 2001
10.997 mln.
-31.203 mln.
-73.94%
1 janv. 2002
14.385 mln.
+3.388 mln.
30.8%
1 janv. 2003
20.155 mln.
+5.77 mln.
40.11%
1 janv. 2004
30.512 mln.
+10.357 mln.
51.38%
1 janv. 2005
27.044 mln.
-3.467 mln.
-11.36%
1 janv. 2006
29.45 mln.
+2.406 mln.
8.9%
1 janv. 2007
25.592 mln.
-3.858 mln.
-13.1%
1 janv. 2008
35.301 mln.
+9.709 mln.
37.94%
1 janv. 2009
52.556 mln.
+17.254 mln.
48.88%
1 janv. 2010
68.208 mln.
+15.652 mln.
29.78%
1 janv. 2011
74.111 mln.
+5.903 mln.
8.65%
1 janv. 2012
92.819 mln.
+18.709 mln.
25.24%
1 janv. 2013
118.094 mln.
+25.275 mln.
27.23%
1 janv. 2014
122.079 mln.
+3.985 mln.
3.37%
1 janv. 2015
119.07 mln.
-3.009 mln.
-2.46%
1 janv. 2016
103.462 mln.
-15.608 mln.
-13.11%
Classement des pays selon les statistiques actuelles par années