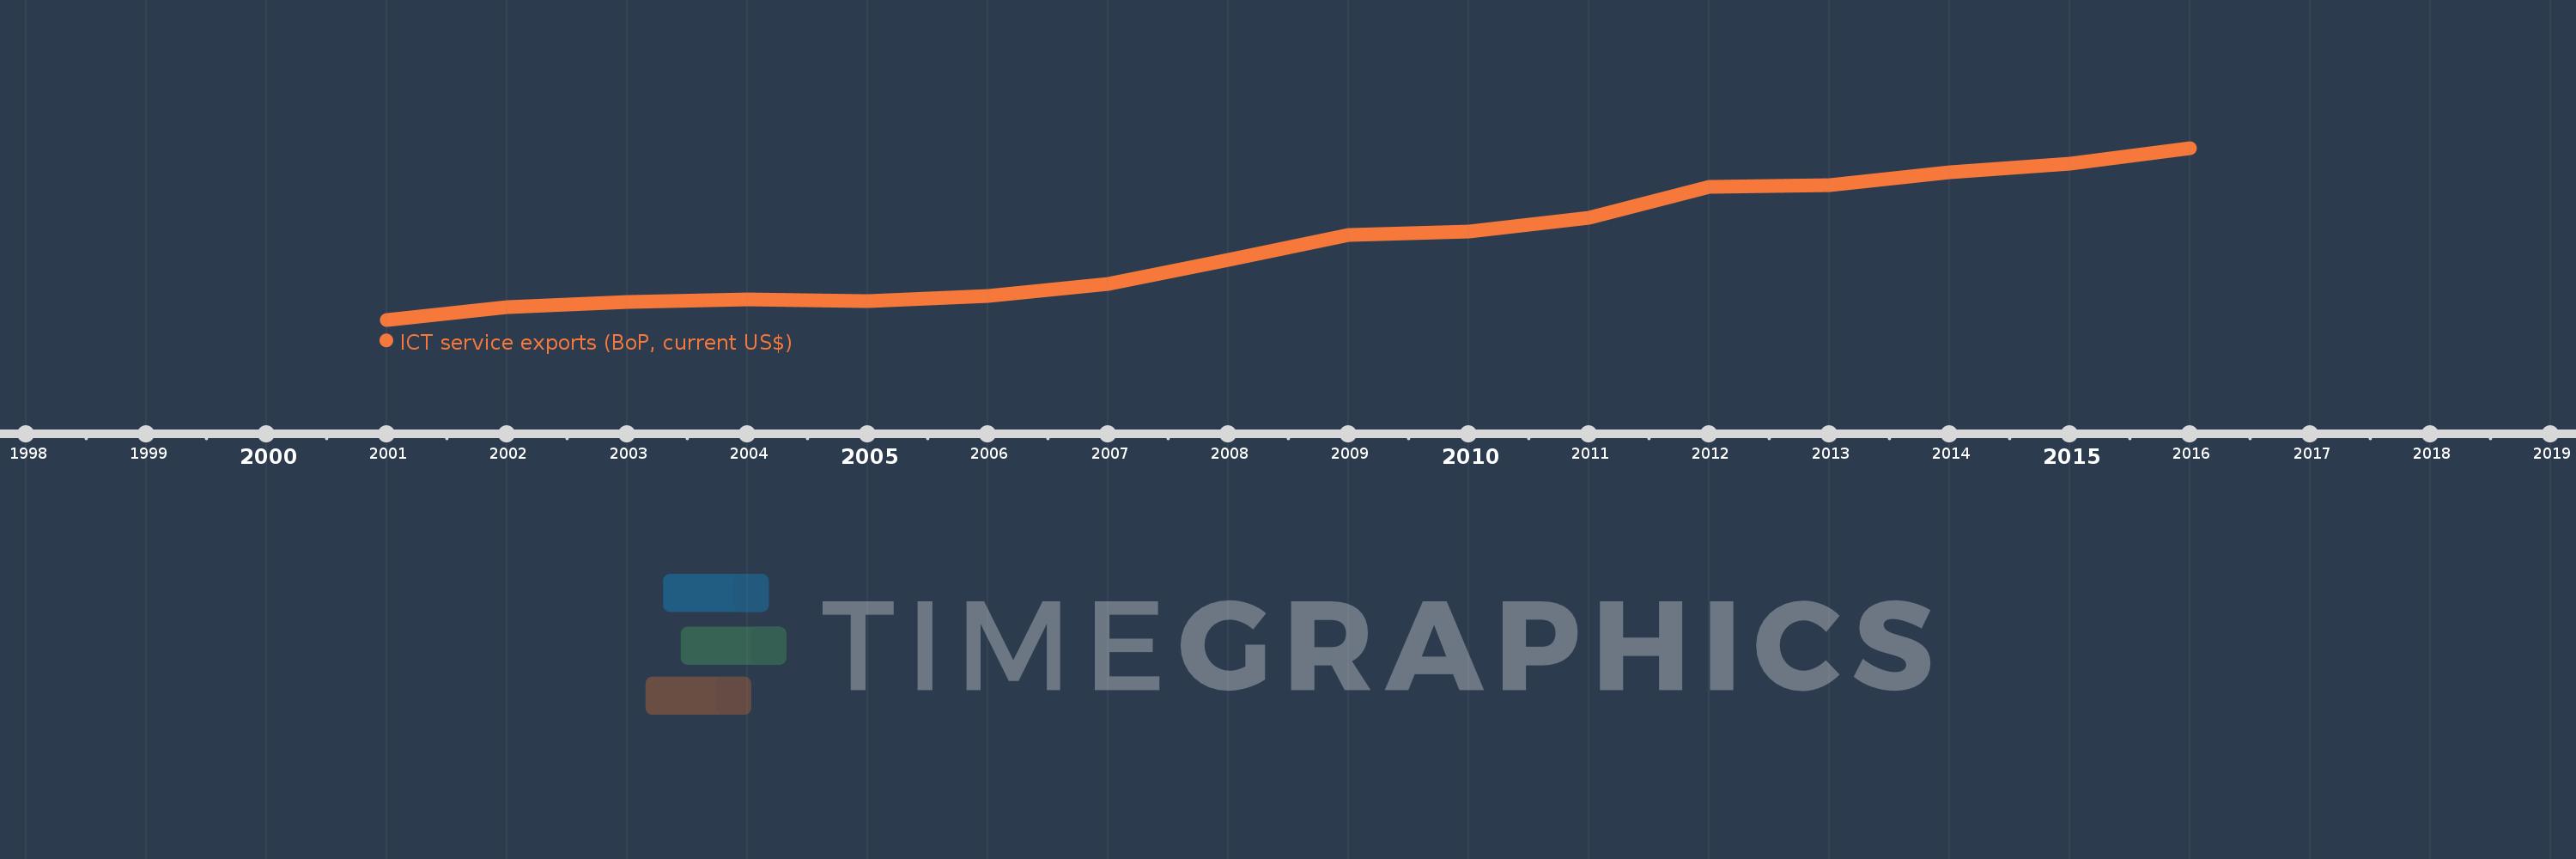
Cette échelle de temps montre un graphique de 2001 année à 2016 année Sri Lanka. Les données jusqu'à 2000 année ne sont pas présentés. Quantité d'observations actuelles selon dates: 16.
Source (désignation):
Les indicateurs du développement mondiale
Source (organisation):
International Monetary Fund, Balance of Payments Statistics Yearbook and data files.
Catégories:
Economy & Growth, Infrastructure, Trade
Dernière mise à jour
23 avr. 2017
Les indicateurs de changement de valeurs selon les années
En moyenne:
498.754 mln.
Minimum:
226.995 mln.
1 janv. 2001
Maximum:
847.176 mln.
1 janv. 2016
Pour la date d''observation
Valeur
Changement absolu
Le changement par rapport à la valeur précédente
1 janv. 2001
226.995 mln.
+226.995 mln.
0.0%
1 janv. 2002
273.57 mln.
+46.575 mln.
20.52%
1 janv. 2003
290.17 mln.
+16.6 mln.
6.07%
1 janv. 2004
299.34 mln.
+9.17 mln.
3.16%
1 janv. 2005
293.02 mln.
-6.32 mln.
-2.11%
1 janv. 2006
313.98 mln.
+20.96 mln.
7.15%
1 janv. 2007
356.3 mln.
+42.32 mln.
13.48%
1 janv. 2008
443.6 mln.
+87.3 mln.
24.5%
1 janv. 2009
532.1 mln.
+88.5 mln.
19.95%
1 janv. 2010
544.0 mln.
+11.9 mln.
2.24%
1 janv. 2011
593.76 mln.
+49.76 mln.
9.15%
1 janv. 2012
706.0 mln.
+112.24 mln.
18.9%
1 janv. 2013
711.652 mln.
+5.652 mln.
0.8%
1 janv. 2014
757.886 mln.
+46.234 mln.
6.5%
1 janv. 2015
790.52 mln.
+32.634 mln.
4.31%
1 janv. 2016
847.176 mln.
+56.656 mln.
7.17%
Classement des pays selon les statistiques actuelles par années