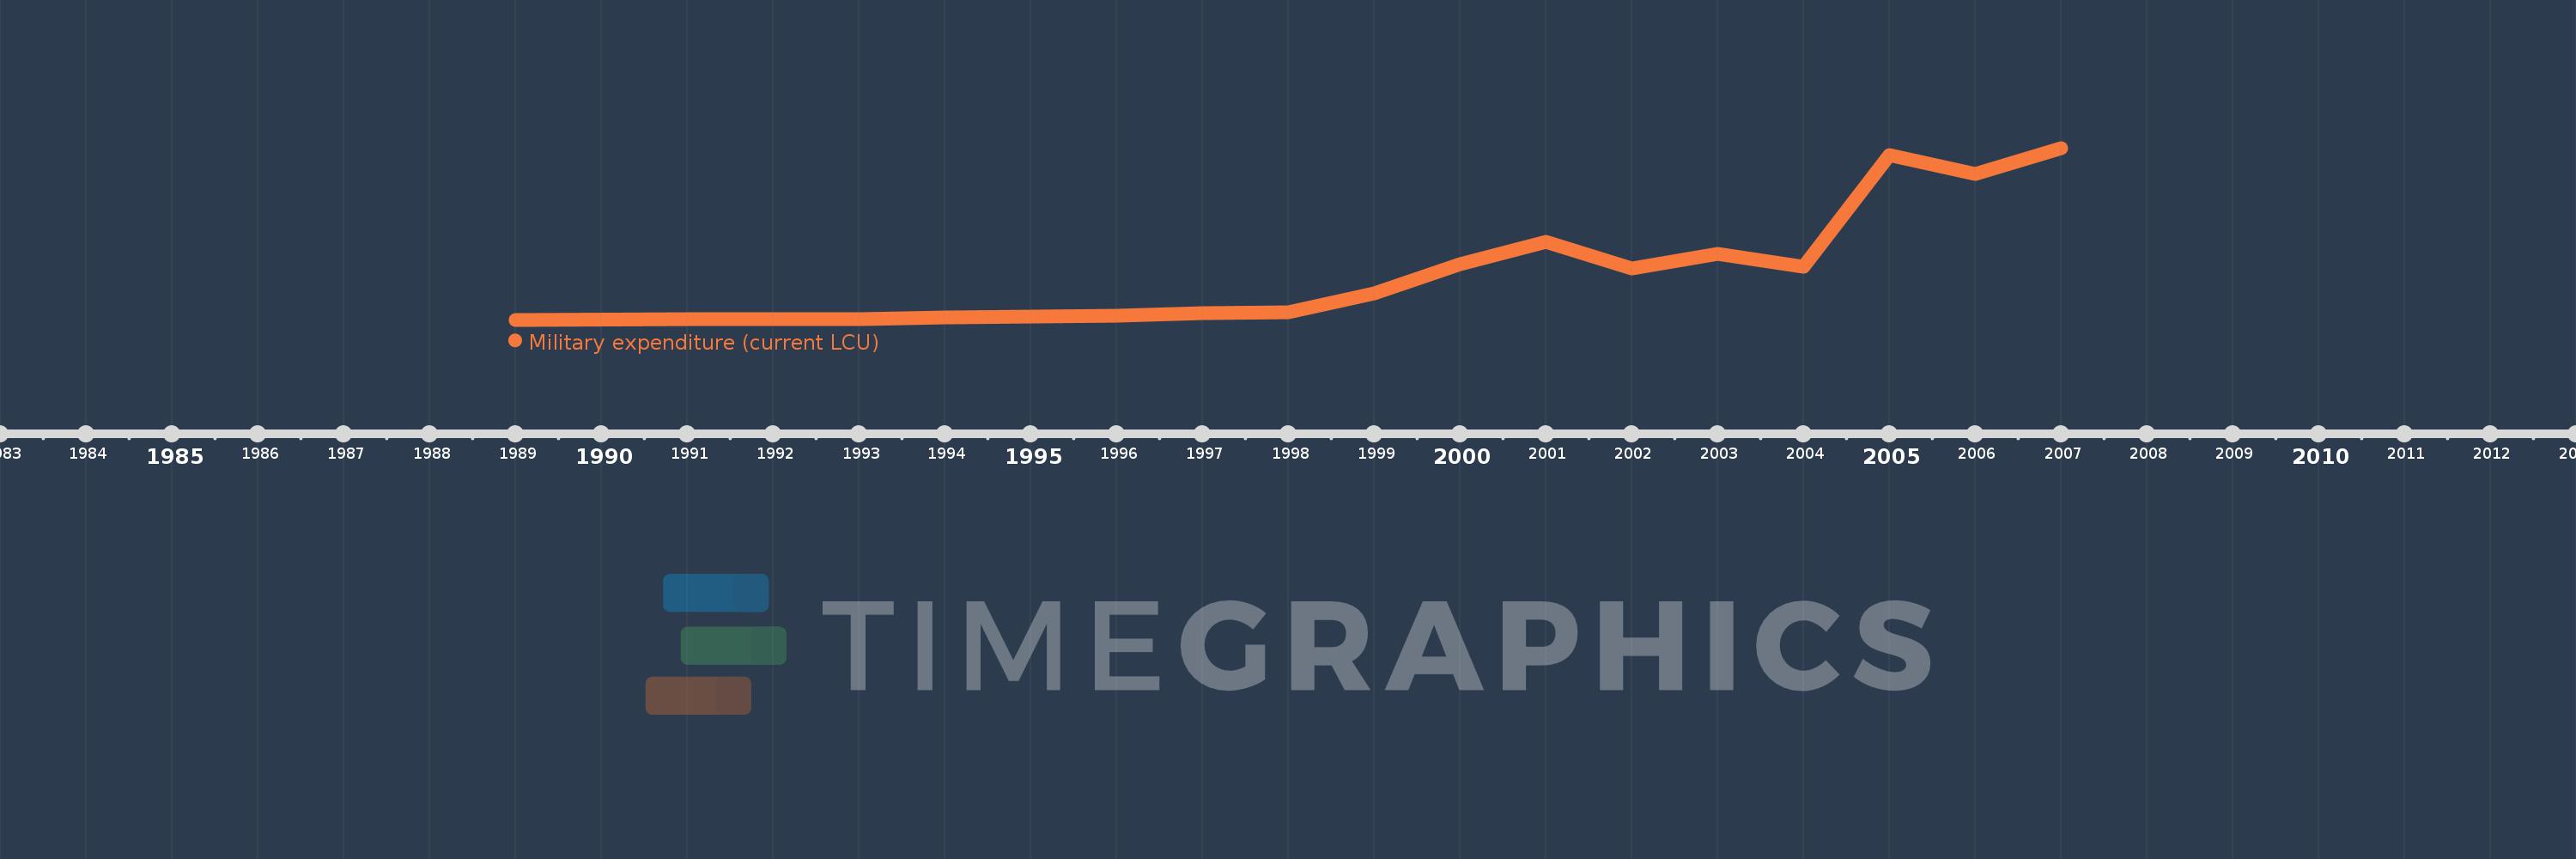
Cette échelle de temps montre un graphique de 1989 année à 2007 année Sudan. Les données jusqu'à 1988 année ne sont pas présentés. Quantité d'observations actuelles selon dates: 18.
Source (désignation):
Les indicateurs du développement mondiale
Source (organisation):
Stockholm International Peace Research Institute (SIPRI), Yearbook: Armaments, Disarmament and International Security.
Catégories:
Public Sector
Dernière mise à jour
23 avr. 2017
Les indicateurs de changement de valeurs selon les années
En moyenne:
906.698 mln.
Minimum:
1.662 mln.
1 janv. 1989
Maximum:
3.338 mds
1 janv. 2007
Pour la date d''observation
Valeur
Changement absolu
Le changement par rapport à la valeur précédente
1 janv. 1989
1.662 mln.
+1.662 mln.
0.0%
1 janv. 1991
5.3 mln.
+3.638 mln.
218.89%
1 janv. 1992
9.5 mln.
+4.2 mln.
79.25%
1 janv. 1993
17.9 mln.
+8.4 mln.
88.42%
1 janv. 1994
41.1 mln.
+23.2 mln.
129.61%
1 janv. 1995
65.5 mln.
+24.4 mln.
59.37%
1 janv. 1996
80.6 mln.
+15.1 mln.
23.05%
1 janv. 1997
133.0 mln.
+52.4 mln.
65.01%
1 janv. 1998
154.0 mln.
+21.0 mln.
15.79%
1 janv. 1999
522.0 mln.
+368.0 mln.
238.96%
1 janv. 2000
1.085 mds
+563.0 mln.
107.85%
1 janv. 2001
1.51 mds
+425.0 mln.
39.17%
1 janv. 2002
1.004 mds
-506.0 mln.
-33.51%
1 janv. 2003
1.276 mds
+272.0 mln.
27.09%
1 janv. 2004
1.039 mds
-237.0 mln.
-18.57%
1 janv. 2005
3.2 mds
+2.161 mds
207.99%
1 janv. 2006
2.838 mds
-362.0 mln.
-11.31%
1 janv. 2007
3.338 mds
+500.0 mln.
17.62%
Classement des pays selon les statistiques actuelles par années