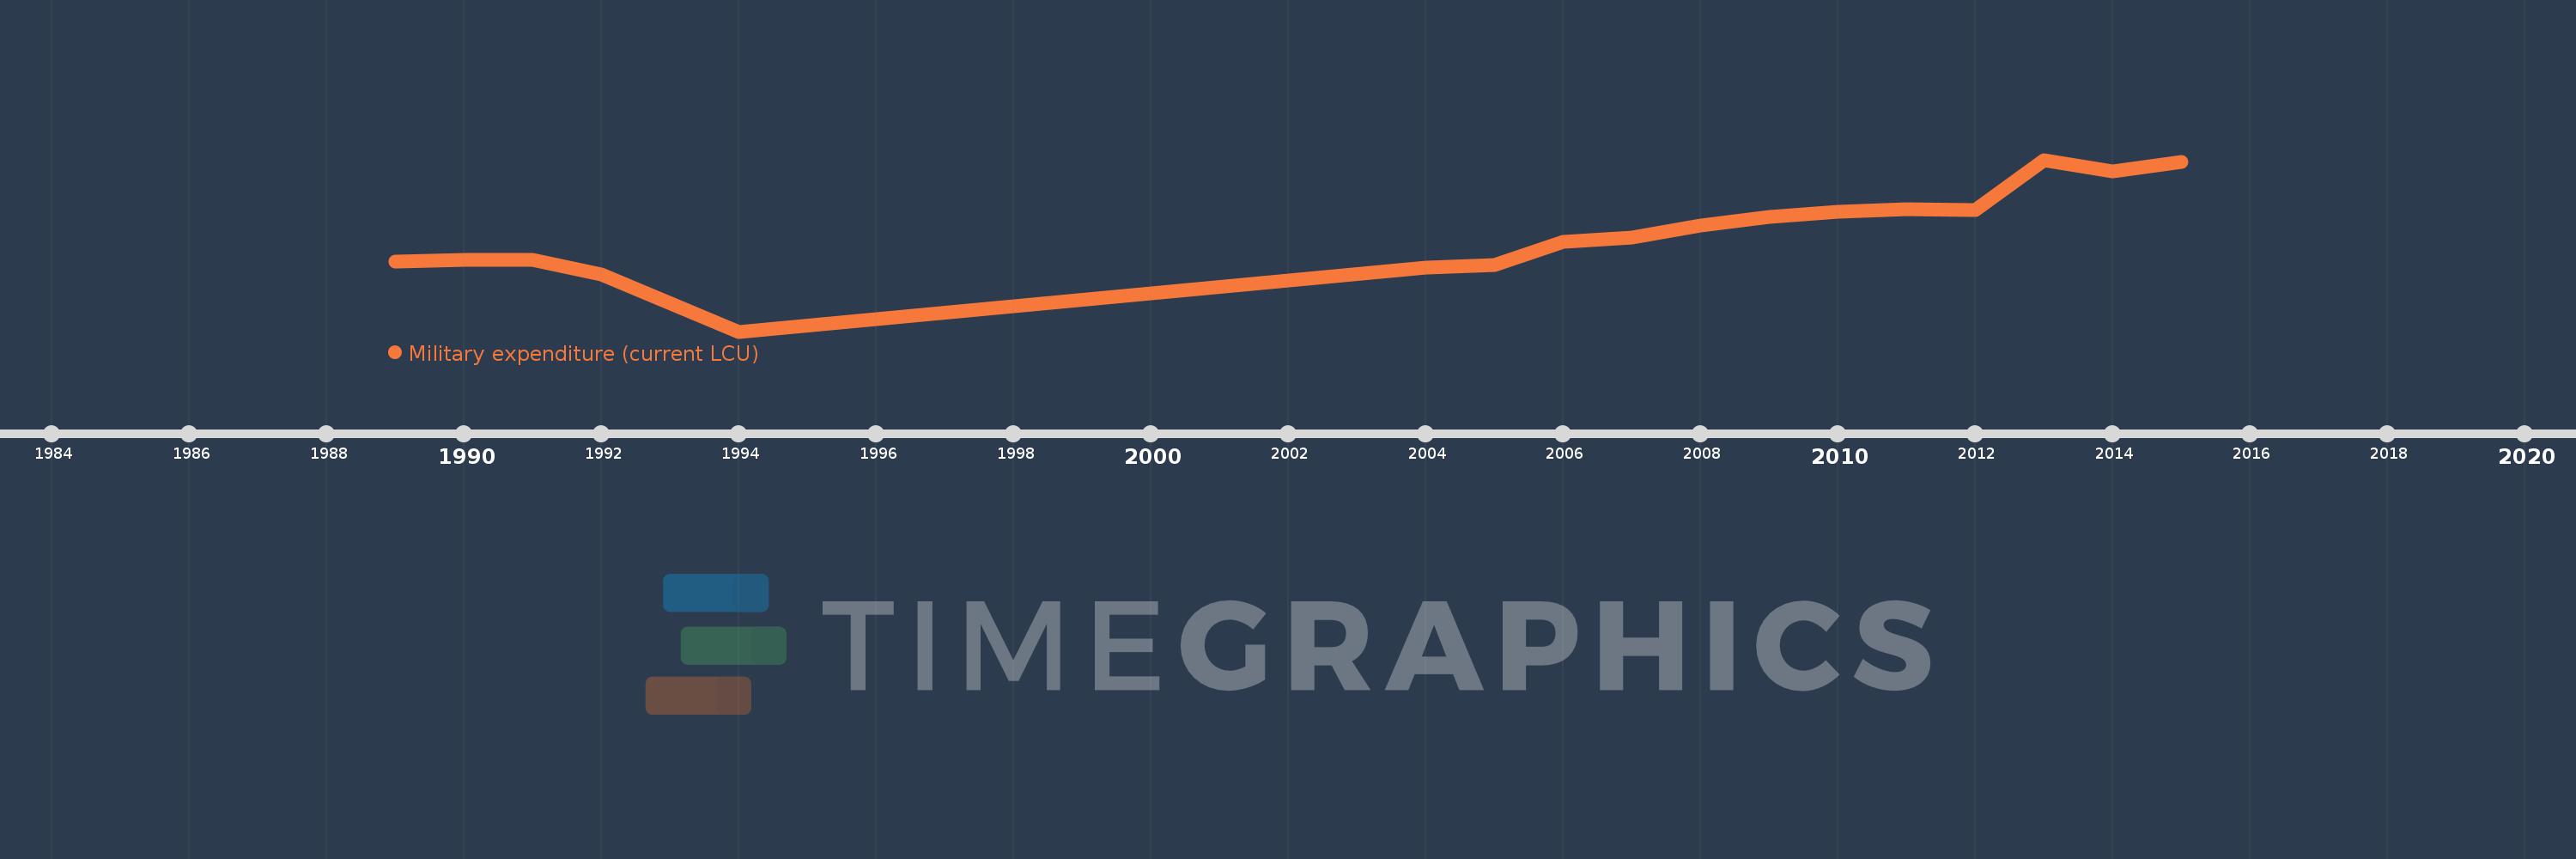
Cette échelle de temps montre un graphique de 1989 année à 2015 année Cuba. Les données jusqu'à 1988 année ne sont pas présentés. Quantité d'observations actuelles selon dates: 17.
Source (désignation):
Les indicateurs du développement mondiale
Source (organisation):
Stockholm International Peace Research Institute (SIPRI), Yearbook: Armaments, Disarmament and International Security.
Catégories:
Public Sector
Dernière mise à jour
23 avr. 2017
Les indicateurs de changement de valeurs selon les années
En moyenne:
1.777 mds
Minimum:
300.0 mln.
1 janv. 1994
Maximum:
2.88 mds
1 janv. 2013
Pour la date d''observation
Valeur
Changement absolu
Le changement par rapport à la valeur précédente
1 janv. 1989
1.35 mds
+1.35 mds
0.0%
1 janv. 1990
1.377 mds
+27.0 mln.
2.0%
1 janv. 1991
1.38 mds
+3.0 mln.
0.22%
1 janv. 1992
1.16 mds
-220.0 mln.
-15.94%
1 janv. 1994
300.0 mln.
-860.0 mln.
-74.14%
1 janv. 2004
1.259 mds
+959.0 mln.
319.67%
1 janv. 2005
1.303 mds
+44.0 mln.
3.49%
1 janv. 2006
1.65 mds
+346.7 mln.
26.61%
1 janv. 2007
1.708 mds
+58.2 mln.
3.53%
1 janv. 2008
1.892 mds
+184.5 mln.
10.8%
1 janv. 2009
2.022 mds
+129.2 mln.
6.83%
1 janv. 2010
2.099 mds
+77.3 mln.
3.82%
1 janv. 2011
2.14 mds
+41.2 mln.
1.96%
1 janv. 2012
2.128 mds
-12.1 mln.
-0.57%
1 janv. 2013
2.88 mds
+752.0 mln.
35.34%
1 janv. 2014
2.71 mds
-170.0 mln.
-5.9%
1 janv. 2015
2.852 mds
+142.0 mln.
5.24%
Classement des pays selon les statistiques actuelles par années