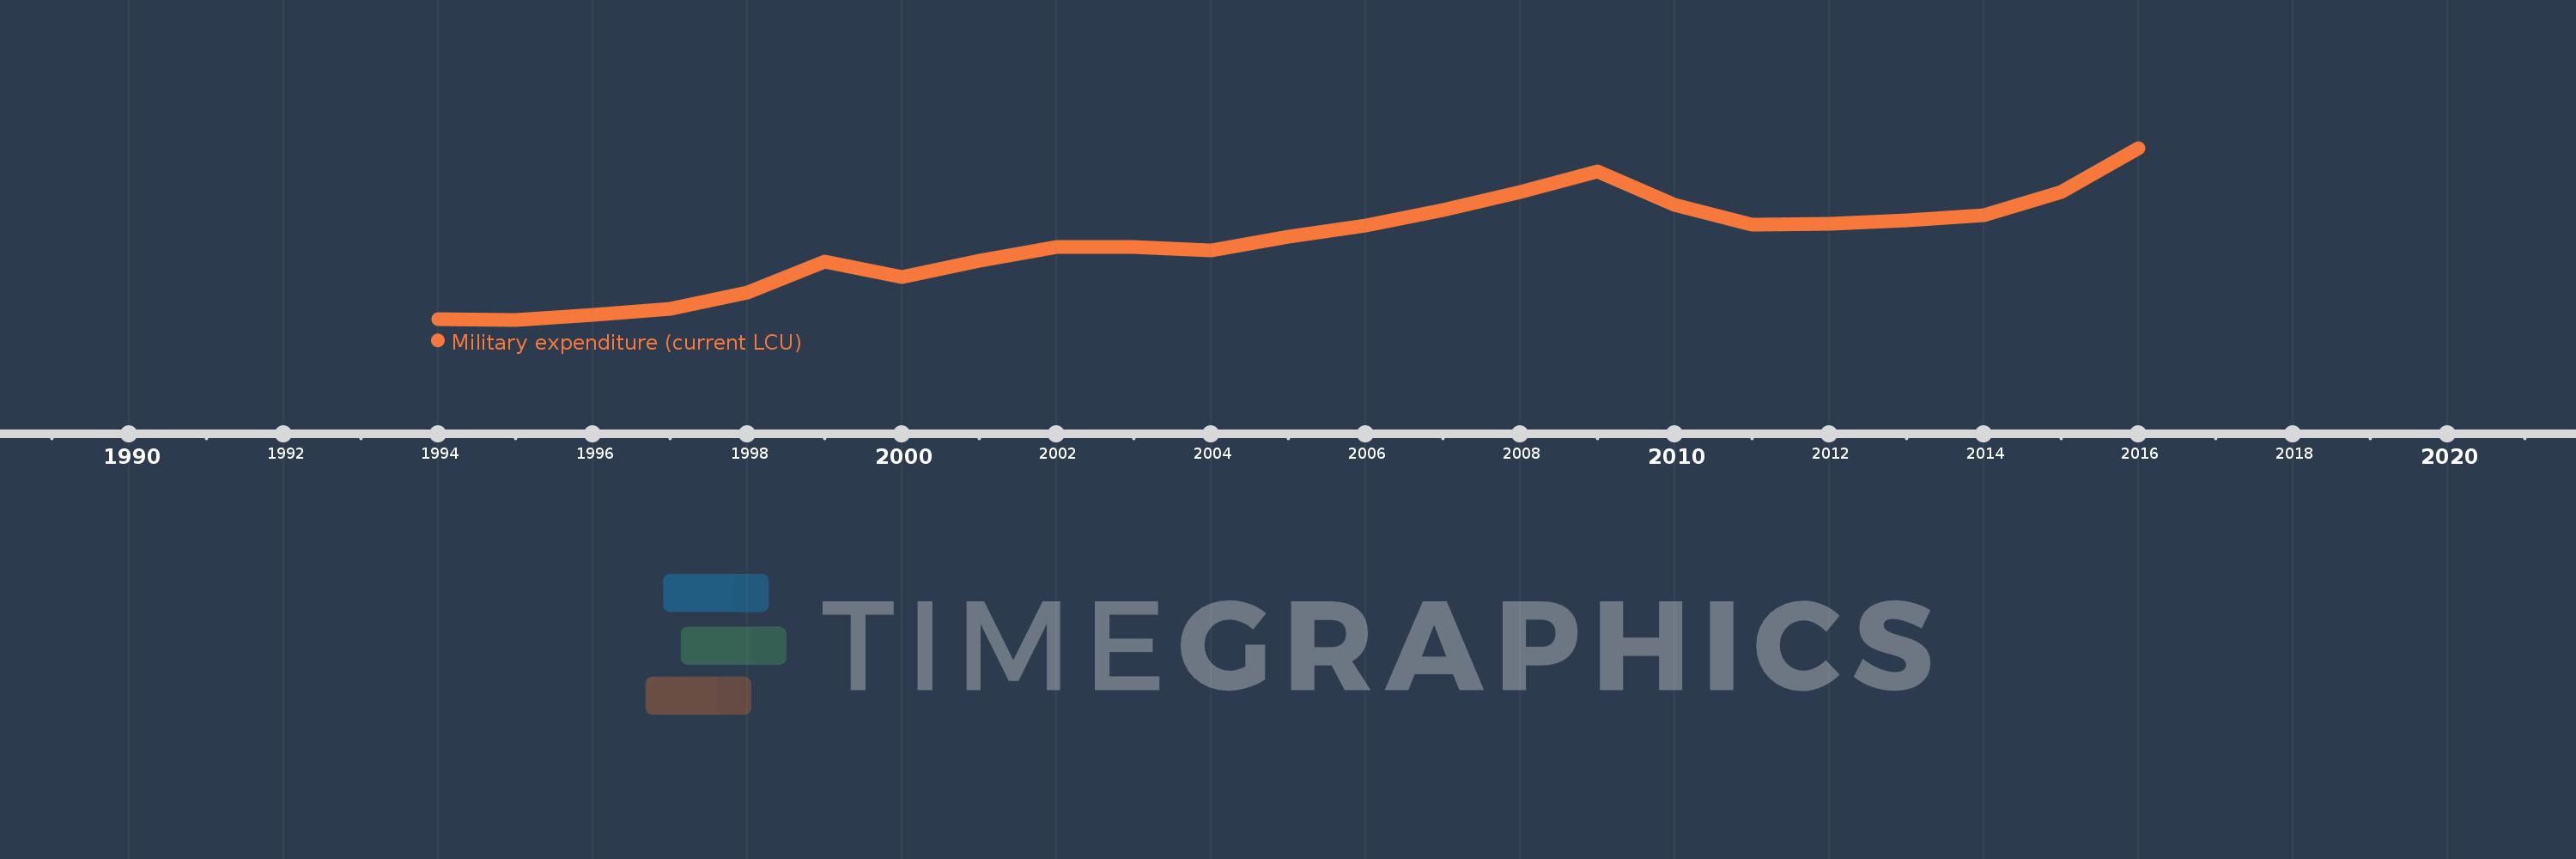
Cette échelle de temps montre un graphique de 1994 année à 2016 année Lithuania. Les données jusqu'à 1993 année ne sont pas présentés. Quantité d'observations actuelles selon dates: 23.
Source (désignation):
Les indicateurs du développement mondiale
Source (organisation):
Stockholm International Peace Research Institute (SIPRI), Yearbook: Armaments, Disarmament and International Security.
Catégories:
Public Sector
Dernière mise à jour
23 avr. 2017
Les indicateurs de changement de valeurs selon les années
En moyenne:
205.732 mln.
Minimum:
24.264 mln.
1 janv. 1995
Maximum:
425.0 mln.
1 janv. 2016
Pour la date d''observation
Valeur
Changement absolu
Le changement par rapport à la valeur précédente
1 janv. 1994
26.131 mln.
+26.131 mln.
0.0%
1 janv. 1995
24.264 mln.
-1.866 mln.
-7.14%
1 janv. 1996
35.28 mln.
+11.015 mln.
45.4%
1 janv. 1997
48.957 mln.
+13.677 mln.
38.77%
1 janv. 1998
87.594 mln.
+38.636 mln.
78.92%
1 janv. 1999
160.073 mln.
+72.479 mln.
82.74%
1 janv. 2000
123.32 mln.
-36.753 mln.
-22.96%
1 janv. 2001
162.651 mln.
+39.33 mln.
31.89%
1 janv. 2002
193.321 mln.
+30.671 mln.
18.86%
1 janv. 2003
193.263 mln.
-57.924 milles
-0.03%
1 janv. 2004
186.892 mln.
-6.372 mln.
-3.3%
1 janv. 2005
218.113 mln.
+31.221 mln.
16.71%
1 janv. 2006
244.092 mln.
+25.979 mln.
11.91%
1 janv. 2007
280.265 mln.
+36.174 mln.
14.82%
1 janv. 2008
323.071 mln.
+42.806 mln.
15.27%
1 janv. 2009
369.584 mln.
+46.513 mln.
14.4%
1 janv. 2010
291.242 mln.
-78.342 mln.
-21.2%
1 janv. 2011
246.322 mln.
-44.92 mln.
-15.42%
1 janv. 2012
247.625 mln.
+1.303 mln.
0.53%
1 janv. 2013
255.677 mln.
+8.051 mln.
3.25%
1 janv. 2014
267.319 mln.
+11.643 mln.
4.55%
1 janv. 2015
321.768 mln.
+54.449 mln.
20.37%
1 janv. 2016
425.0 mln.
+103.232 mln.
32.08%
Classement des pays selon les statistiques actuelles par années