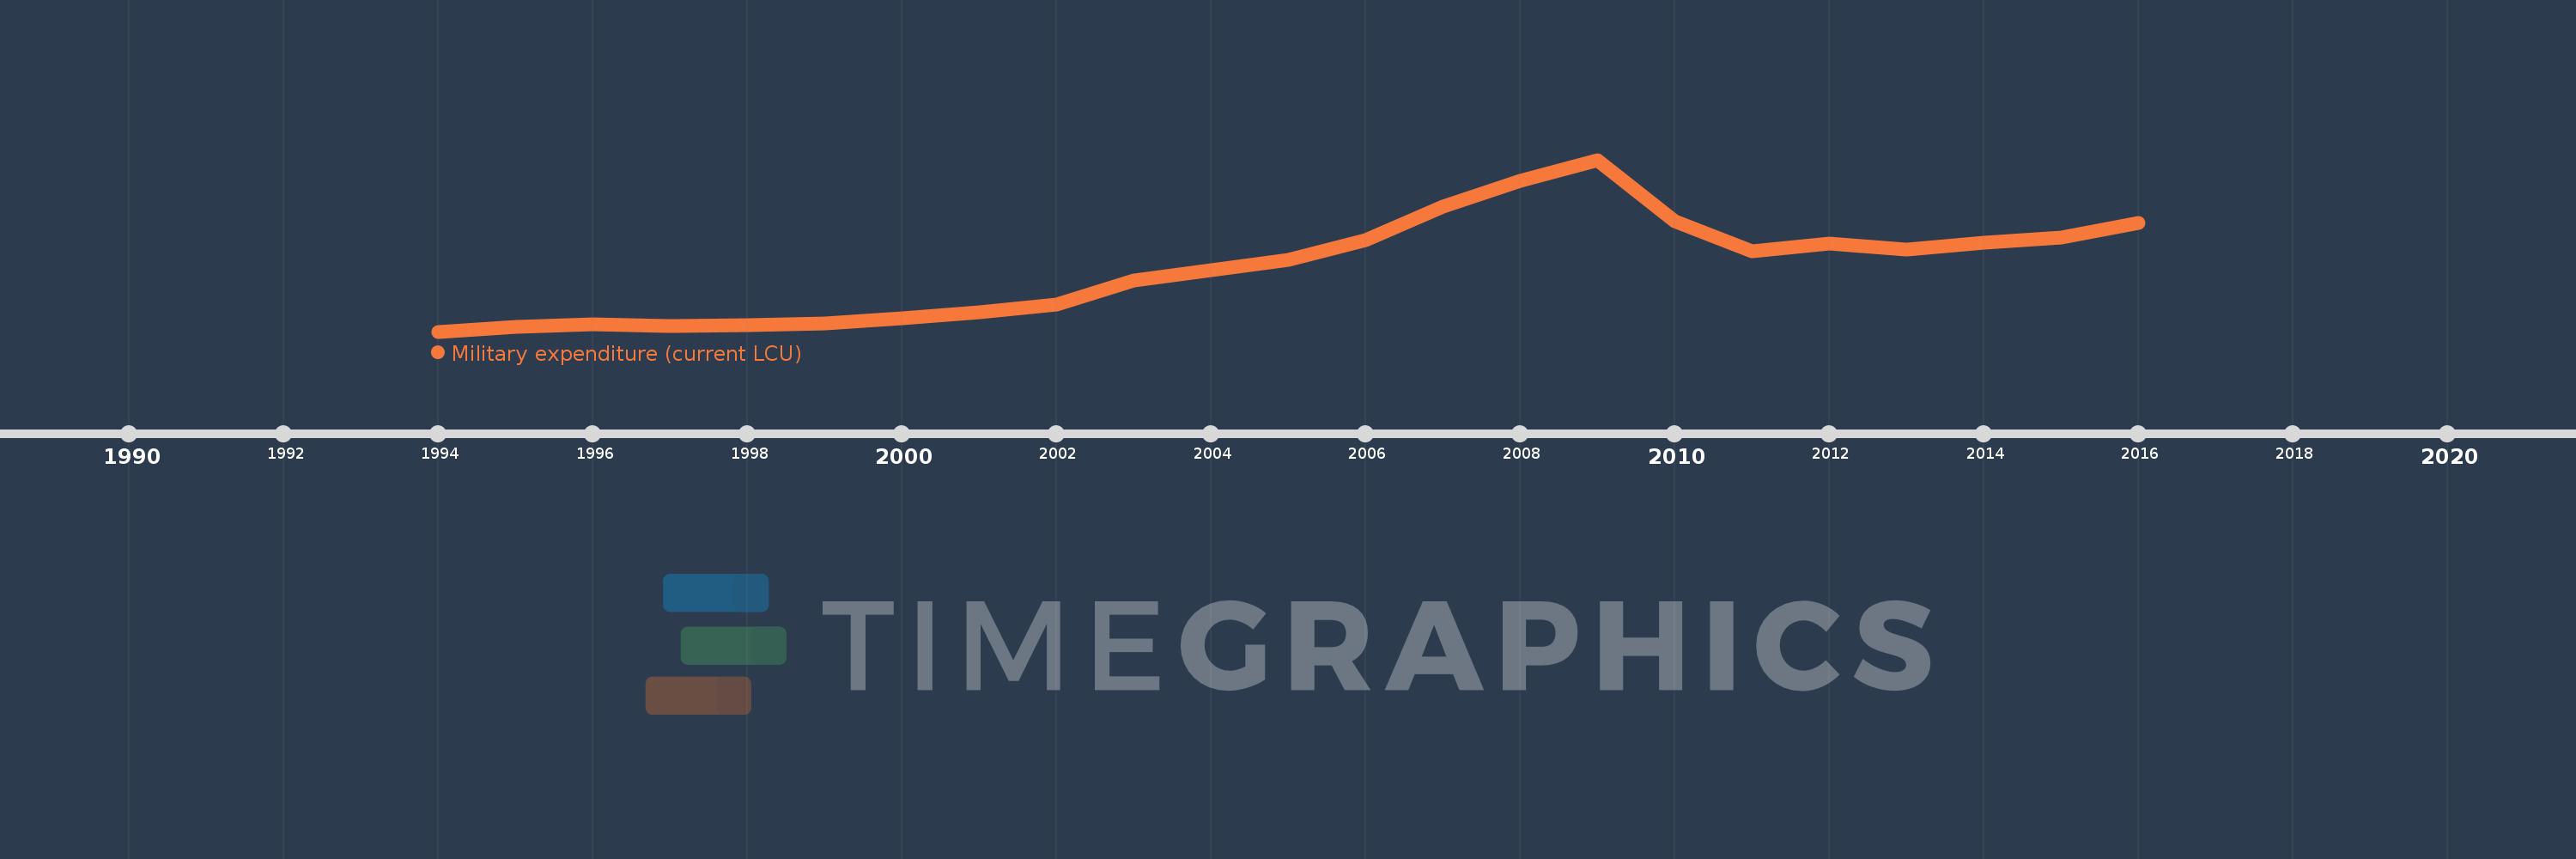
Cette échelle de temps montre un graphique de 1994 année à 2016 année Latvia. Les données jusqu'à 1993 année ne sont pas présentés. Quantité d'observations actuelles selon dates: 23.
Source (désignation):
Les indicateurs du développement mondiale
Source (organisation):
Stockholm International Peace Research Institute (SIPRI), Yearbook: Armaments, Disarmament and International Security.
Catégories:
Public Sector
Dernière mise à jour
23 avr. 2017
Les indicateurs de changement de valeurs selon les années
En moyenne:
158.522 mln.
Minimum:
17.0 mln.
1 janv. 1994
Maximum:
398.0 mln.
1 janv. 2009
Pour la date d''observation
Valeur
Changement absolu
Le changement par rapport à la valeur précédente
1 janv. 1994
17.0 mln.
+17.0 mln.
0.0%
1 janv. 1995
27.0 mln.
+10.0 mln.
58.82%
1 janv. 1996
32.7 mln.
+5.7 mln.
21.11%
1 janv. 1997
29.9 mln.
-2.8 mln.
-8.56%
1 janv. 1998
31.4 mln.
+1.5 mln.
5.02%
1 janv. 1999
35.4 mln.
+4.0 mln.
12.74%
1 janv. 2000
47.1 mln.
+11.7 mln.
33.05%
1 janv. 2001
60.4 mln.
+13.3 mln.
28.24%
1 janv. 2002
77.7 mln.
+17.3 mln.
28.64%
1 janv. 2003
129.5 mln.
+51.8 mln.
66.67%
1 janv. 2004
153.8 mln.
+24.3 mln.
18.76%
1 janv. 2005
176.3 mln.
+22.5 mln.
14.63%
1 janv. 2006
219.0 mln.
+42.7 mln.
24.22%
1 janv. 2007
293.3 mln.
+74.3 mln.
33.93%
1 janv. 2008
352.0 mln.
+58.7 mln.
20.01%
1 janv. 2009
398.0 mln.
+46.0 mln.
13.07%
1 janv. 2010
261.7 mln.
-136.3 mln.
-34.25%
1 janv. 2011
196.0 mln.
-65.7 mln.
-25.11%
1 janv. 2012
211.7 mln.
+15.7 mln.
8.01%
1 janv. 2013
199.0 mln.
-12.7 mln.
-6.0%
1 janv. 2014
213.6 mln.
+14.6 mln.
7.34%
1 janv. 2015
225.7 mln.
+12.1 mln.
5.66%
1 janv. 2016
257.8 mln.
+32.1 mln.
14.22%
Classement des pays selon les statistiques actuelles par années