33
/fr/
AIzaSyAYiBZKx7MnpbEhh9jyipgxe19OcubqV5w
August 1, 2025
199414
Mongolia
MNG
true
2
1
Market capitalization of listed domestic companies (current US$)
2013,2012,2011,2010,2009,2008,2007,2006,2005,2004,2003,2002,2001,2000,1999,1998,1997,1996
Download
Bibliothèque de statistiques globales →Mongolia →

Market capitalization of listed domestic companies (current US$)

Cette statistique dans les autres pays:

Arab WorldArgentinaArmeniaAustraliaAustriaAzerbaijanBahrainBangladeshBarbadosBelgiumBermudaBhutanBoliviaBosnia and HerzegovinaBotswanaBrazilBulgariaCanadaCayman IslandsCentral Europe and the BalticsChannel IslandsChileChinaColombiaCosta RicaCote d'IvoireCroatiaCyprusCzech RepublicDenmarkDominican RepublicEarly-demographic dividendEast Asia & PacificEast Asia & Pacific (excluding high income)East Asia & Pacific (IDA & IBRD countries)EcuadorEgypt, Arab Rep.El SalvadorEuro areaEurope & Central AsiaEurope & Central Asia (excluding high income)Europe & Central Asia (IDA & IBRD countries)European UnionFijiFinlandFranceGeorgiaGermanyGhanaGreeceGuyanaHigh incomeHondurasHong Kong SAR, ChinaHungaryIBRD onlyIDA & IBRD totalIDA blendIndiaIndonesiaIran, Islamic Rep.IrelandIsraelItalyJamaicaJapanJordanKazakhstanKenyaKorea, Dem. People’s Rep.Korea, Rep.KuwaitKyrgyz RepublicLate-demographic dividendLatin America & Caribbean Latin America & Caribbean (excluding high income)Latin America & the Caribbean (IDA & IBRD countries)LebanonLow & middle incomeLower middle incomeLuxembourgMacedonia, FYRMalawiMalaysiaMaltaMauritiusMexicoMiddle East & North AfricaMiddle East & North Africa (excluding high income)Middle East & North Africa (IDA & IBRD countries)Middle incomeMoldovaMongoliaMontenegroMoroccoNamibiaNetherlandsNew ZealandNigeriaNorth AmericaNorwayOECD membersOmanPakistanPanamaPapua New GuineaParaguayPeruPhilippinesPolandPortugalPost-demographic dividendQatarRomaniaRussian FederationSaudi ArabiaSerbiaSingaporeSlovak RepublicSloveniaSouth AfricaSouth AsiaSouth Asia (IDA & IBRD)SpainSri LankaSt. Kitts and NevisSub-Saharan Africa Sub-Saharan Africa (excluding high income)Sub-Saharan Africa (IDA & IBRD countries)SwazilandSwedenSwitzerlandTanzaniaThailandTrinidad and TobagoTunisiaTurkeyUgandaUkraineUnited Arab EmiratesUnited KingdomUnited StatesUpper middle incomeUruguayUzbekistanVenezuela, RBVietnamWest Bank and GazaWorldZambiaZimbabwe

La ligne de temps

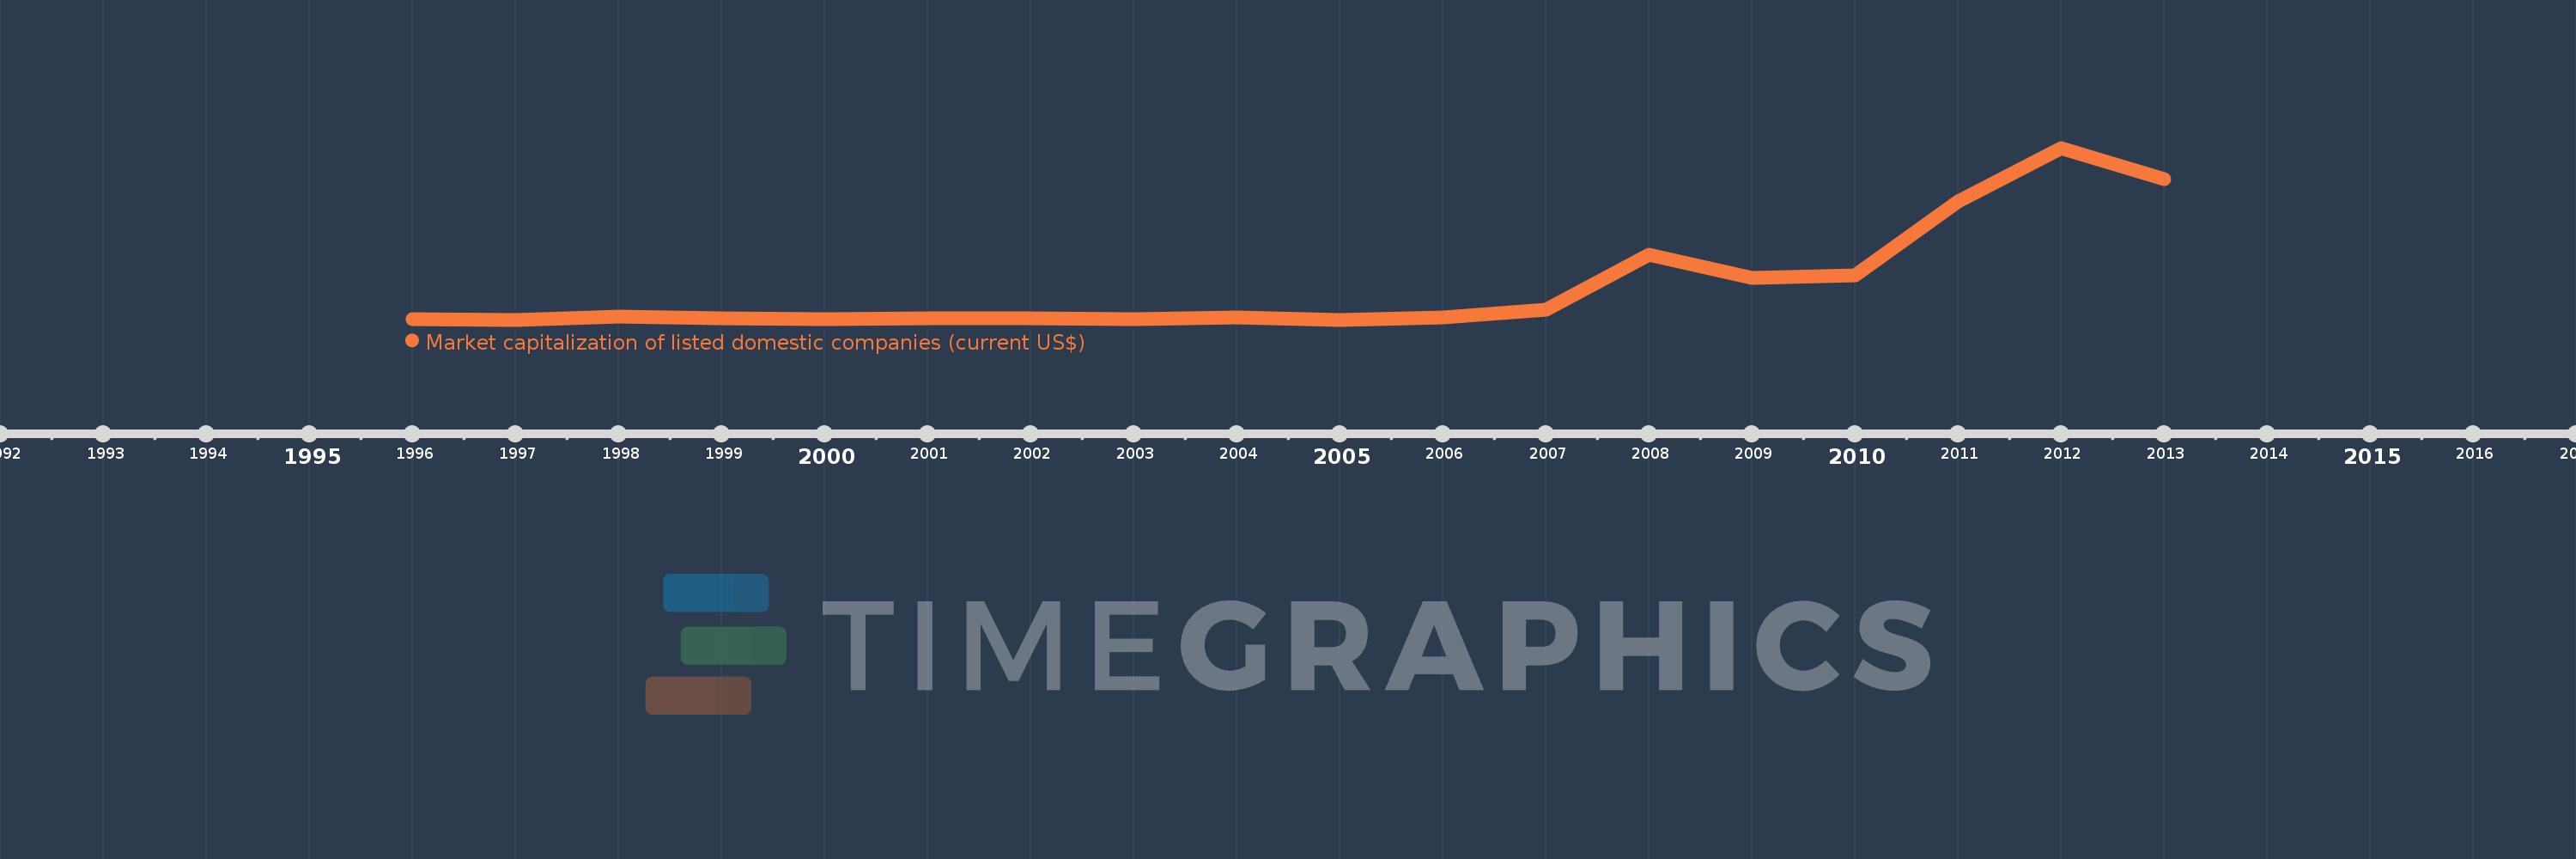
Cette échelle de temps montre un graphique de 1996 année à 2013 année Mongolia. Les données jusqu'à 1995 année ne sont pas présentés. Quantité d'observations actuelles selon dates: 18.

Source (désignation):

Les indicateurs du développement mondiale

Source (organisation):

World Federation of Exchanges database.

Catégories:

Financial Sector

Dernière mise à jour

23 avr. 2017

Les indicateurs de changement de valeurs selon les années

En moyenne:
329.147 mln.
Minimum:
24.8 mln.
1 janv. 2005
Maximum:
1.579 mds
1 janv. 2012
Pour la date d''observation
Valeur
Changement absolu
Le changement par rapport à la valeur précédente
1 janv. 1996
27.0 mln.
+27.0 mln.
0.0%
1 janv. 1997
26.0 mln.
-1000.0 milles
-3.7%
1 janv. 1998
54.0 mln.
+28.0 mln.
107.69%
1 janv. 1999
40.0 mln.
-14.0 mln.
-25.93%
1 janv. 2000
32.105 mln.
-7.895 mln.
-19.74%
1 janv. 2001
36.9 mln.
+4.795 mln.
14.94%
1 janv. 2002
37.46 mln.
+560.0 milles
1.52%
1 janv. 2003
31.865 mln.
-5.595 mln.
-14.94%
1 janv. 2004
42.39 mln.
+10.525 mln.
33.03%
1 janv. 2005
24.8 mln.
-17.59 mln.
-41.5%
1 janv. 2006
45.619 mln.
+20.819 mln.
83.95%
1 janv. 2007
112.6 mln.
+66.981 mln.
146.83%
1 janv. 2008
612.2 mln.
+499.6 mln.
443.69%
1 janv. 2009
406.997 mln.
-205.203 mln.
-33.52%
1 janv. 2010
430.197 mln.
+23.201 mln.
5.7%
1 janv. 2011
1.093 mds
+662.803 mln.
154.07%
1 janv. 2012
1.579 mds
+485.573 mln.
44.43%
1 janv. 2013
1.293 mds
-285.636 mln.
-18.09%

Classement des pays selon les statistiques actuelles par années