29
/fr/
fr
AIzaSyAYiBZKx7MnpbEhh9jyipgxe19OcubqV5w
April 1, 2024
101912
Cayman Islands
CYM
true
2
1
Market capitalization of listed domestic companies (current US$)
2016,2013,2012,2011,2010,2009,2008,2007,2006,2005,2004,2003,2002,2001,2000,1999,1998
Download
Bibliothèque de statistiques globales →Cayman Islands →

Market capitalization of listed domestic companies (current US$)

Cette statistique dans les autres pays:
Arab WorldArgentinaArmeniaAustraliaAustriaAzerbaijanBahrainBangladeshBarbadosBelgiumBermudaBhutanBoliviaBosnia and HerzegovinaBotswanaBrazilBulgariaCanadaCayman IslandsCentral Europe and the BalticsChannel IslandsChileChinaColombiaCosta RicaCote d'IvoireCroatiaCyprusCzech RepublicDenmarkDominican RepublicEarly-demographic dividendEast Asia & PacificEast Asia & Pacific (excluding high income)East Asia & Pacific (IDA & IBRD countries)EcuadorEgypt, Arab Rep.El SalvadorEuro areaEurope & Central AsiaEurope & Central Asia (excluding high income)Europe & Central Asia (IDA & IBRD countries)European UnionFijiFinlandFranceGeorgiaGermanyGhanaGreeceGuyanaHigh incomeHondurasHong Kong SAR, ChinaHungaryIBRD onlyIDA & IBRD totalIDA blendIndiaIndonesiaIran, Islamic Rep.IrelandIsraelItalyJamaicaJapanJordanKazakhstanKenyaKorea, Dem. People’s Rep.Korea, Rep.KuwaitKyrgyz RepublicLate-demographic dividendLatin America & Caribbean Latin America & Caribbean (excluding high income)Latin America & the Caribbean (IDA & IBRD countries)LebanonLow & middle incomeLower middle incomeLuxembourgMacedonia, FYRMalawiMalaysiaMaltaMauritiusMexicoMiddle East & North AfricaMiddle East & North Africa (excluding high income)Middle East & North Africa (IDA & IBRD countries)Middle incomeMoldovaMongoliaMontenegroMoroccoNamibiaNetherlandsNew ZealandNigeriaNorth AmericaNorwayOECD membersOmanPakistanPanamaPapua New GuineaParaguayPeruPhilippinesPolandPortugalPost-demographic dividendQatarRomaniaRussian FederationSaudi ArabiaSerbiaSingaporeSlovak RepublicSloveniaSouth AfricaSouth AsiaSouth Asia (IDA & IBRD)SpainSri LankaSt. Kitts and NevisSub-Saharan Africa Sub-Saharan Africa (excluding high income)Sub-Saharan Africa (IDA & IBRD countries)SwazilandSwedenSwitzerlandTanzaniaThailandTrinidad and TobagoTunisiaTurkeyUgandaUkraineUnited Arab EmiratesUnited KingdomUnited StatesUpper middle incomeUruguayUzbekistanVenezuela, RBVietnamWest Bank and GazaWorldZambiaZimbabwe
La ligne de temps
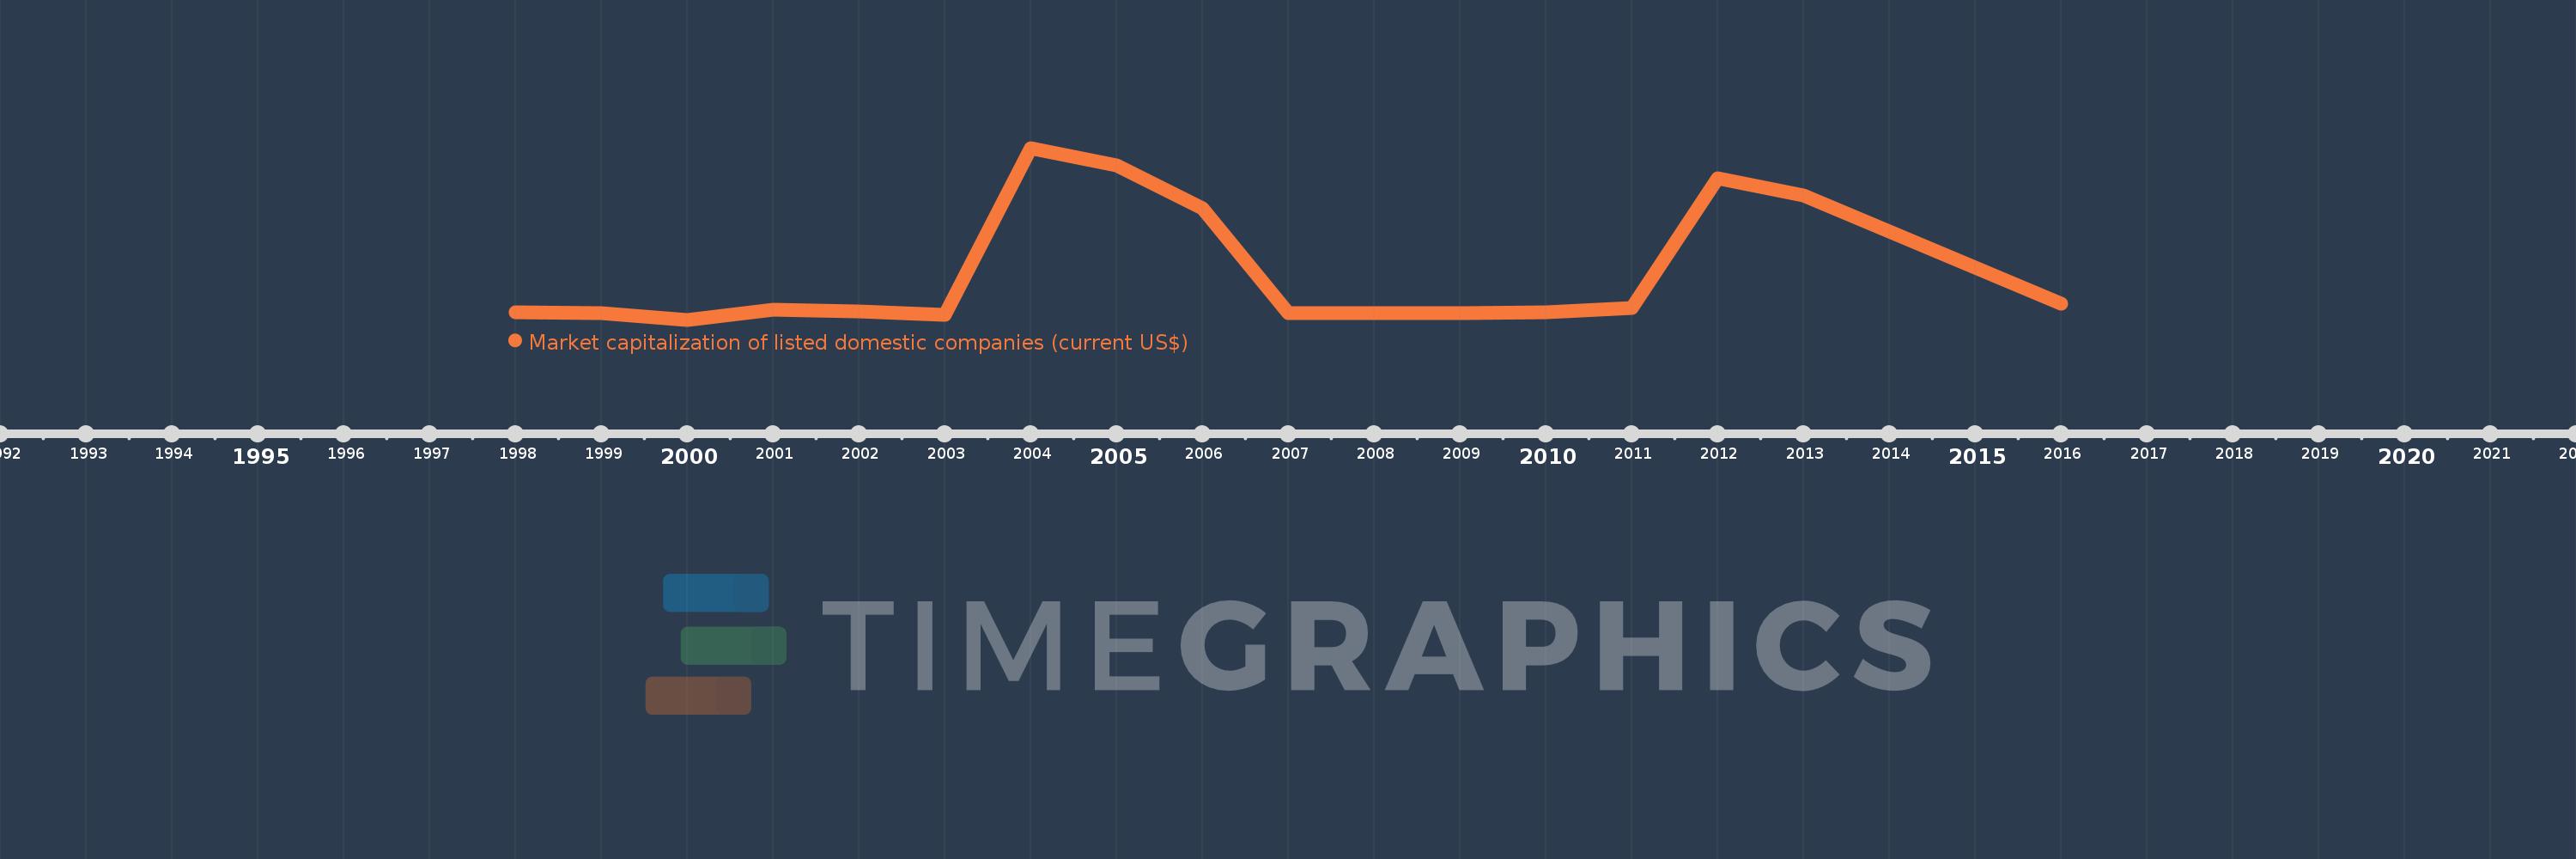
Cette échelle de temps montre un graphique de 1998 année à 2016 année Cayman Islands. Les données jusqu'à 1997 année ne sont pas présentés. Quantité d'observations actuelles selon dates: 17.
Source (désignation):
Les indicateurs du développement mondiale
Source (organisation):
World Federation of Exchanges database.
Catégories:
Financial Sector
Dernière mise à jour
23 avr. 2017
Les indicateurs de changement de valeurs selon les années
En moyenne:
792.256 mln.
Minimum:
58.0 mln.
1 janv. 2000
Maximum:
2.752 mds
1 janv. 2004
Pour la date d''observation
Valeur
Changement absolu
Le changement par rapport à la valeur précédente
1 janv. 1998
169.94 mln.
+169.94 mln.
0.0%
1 janv. 1999
166.12 mln.
-3.82 mln.
-2.25%
1 janv. 2000
58.0 mln.
-108.12 mln.
-65.09%
1 janv. 2001
220.16 mln.
+162.16 mln.
279.59%
1 janv. 2002
189.09 mln.
-31.07 mln.
-14.11%
1 janv. 2003
138.99 mln.
-50.1 mln.
-26.5%
1 janv. 2004
2.752 mds
+2.613 mds
1.88 milles%
1 janv. 2005
2.477 mds
-275.12 mln.
-10.0%
1 janv. 2006
1.81 mds
-666.87 mln.
-26.92%
1 janv. 2007
158.0 mln.
-1.652 mds
-91.27%
1 janv. 2008
165.0 mln.
+7.0 mln.
4.43%
1 janv. 2009
159.0 mln.
-6.0 mln.
-3.64%
1 janv. 2010
169.0 mln.
+10.0 mln.
6.29%
1 janv. 2011
238.0 mln.
+69.0 mln.
40.83%
1 janv. 2012
2.276 mds
+2.038 mds
856.26%
1 janv. 2013
2.006 mds
-269.59 mln.
-11.85%
1 janv. 2016
315.63 mln.
-1.691 mds
-84.27%
Classement des pays selon les statistiques actuelles par années

Commentaires:

Envoyer
PremiumAbout & FeedbackUn accordConfidentialité
logo
© 2022 Selected Technologies LLC – Morgan Hill, California