33
/fr/
AIzaSyAYiBZKx7MnpbEhh9jyipgxe19OcubqV5w
August 1, 2025
184140
Macedonia, FYR
MKD
true
2
1
Market capitalization of listed domestic companies (current US$)
2013,2012,2011,2010,2009,2008,2007,2006,2005,2004,2003,2002,2001,2000,1999,1998,1997
Download
Bibliothèque de statistiques globales →Macedonia, FYR →

Market capitalization of listed domestic companies (current US$)

Cette statistique dans les autres pays:

Arab WorldArgentinaArmeniaAustraliaAustriaAzerbaijanBahrainBangladeshBarbadosBelgiumBermudaBhutanBoliviaBosnia and HerzegovinaBotswanaBrazilBulgariaCanadaCayman IslandsCentral Europe and the BalticsChannel IslandsChileChinaColombiaCosta RicaCote d'IvoireCroatiaCyprusCzech RepublicDenmarkDominican RepublicEarly-demographic dividendEast Asia & PacificEast Asia & Pacific (excluding high income)East Asia & Pacific (IDA & IBRD countries)EcuadorEgypt, Arab Rep.El SalvadorEuro areaEurope & Central AsiaEurope & Central Asia (excluding high income)Europe & Central Asia (IDA & IBRD countries)European UnionFijiFinlandFranceGeorgiaGermanyGhanaGreeceGuyanaHigh incomeHondurasHong Kong SAR, ChinaHungaryIBRD onlyIDA & IBRD totalIDA blendIndiaIndonesiaIran, Islamic Rep.IrelandIsraelItalyJamaicaJapanJordanKazakhstanKenyaKorea, Dem. People’s Rep.Korea, Rep.KuwaitKyrgyz RepublicLate-demographic dividendLatin America & Caribbean Latin America & Caribbean (excluding high income)Latin America & the Caribbean (IDA & IBRD countries)LebanonLow & middle incomeLower middle incomeLuxembourgMacedonia, FYRMalawiMalaysiaMaltaMauritiusMexicoMiddle East & North AfricaMiddle East & North Africa (excluding high income)Middle East & North Africa (IDA & IBRD countries)Middle incomeMoldovaMongoliaMontenegroMoroccoNamibiaNetherlandsNew ZealandNigeriaNorth AmericaNorwayOECD membersOmanPakistanPanamaPapua New GuineaParaguayPeruPhilippinesPolandPortugalPost-demographic dividendQatarRomaniaRussian FederationSaudi ArabiaSerbiaSingaporeSlovak RepublicSloveniaSouth AfricaSouth AsiaSouth Asia (IDA & IBRD)SpainSri LankaSt. Kitts and NevisSub-Saharan Africa Sub-Saharan Africa (excluding high income)Sub-Saharan Africa (IDA & IBRD countries)SwazilandSwedenSwitzerlandTanzaniaThailandTrinidad and TobagoTunisiaTurkeyUgandaUkraineUnited Arab EmiratesUnited KingdomUnited StatesUpper middle incomeUruguayUzbekistanVenezuela, RBVietnamWest Bank and GazaWorldZambiaZimbabwe

La ligne de temps

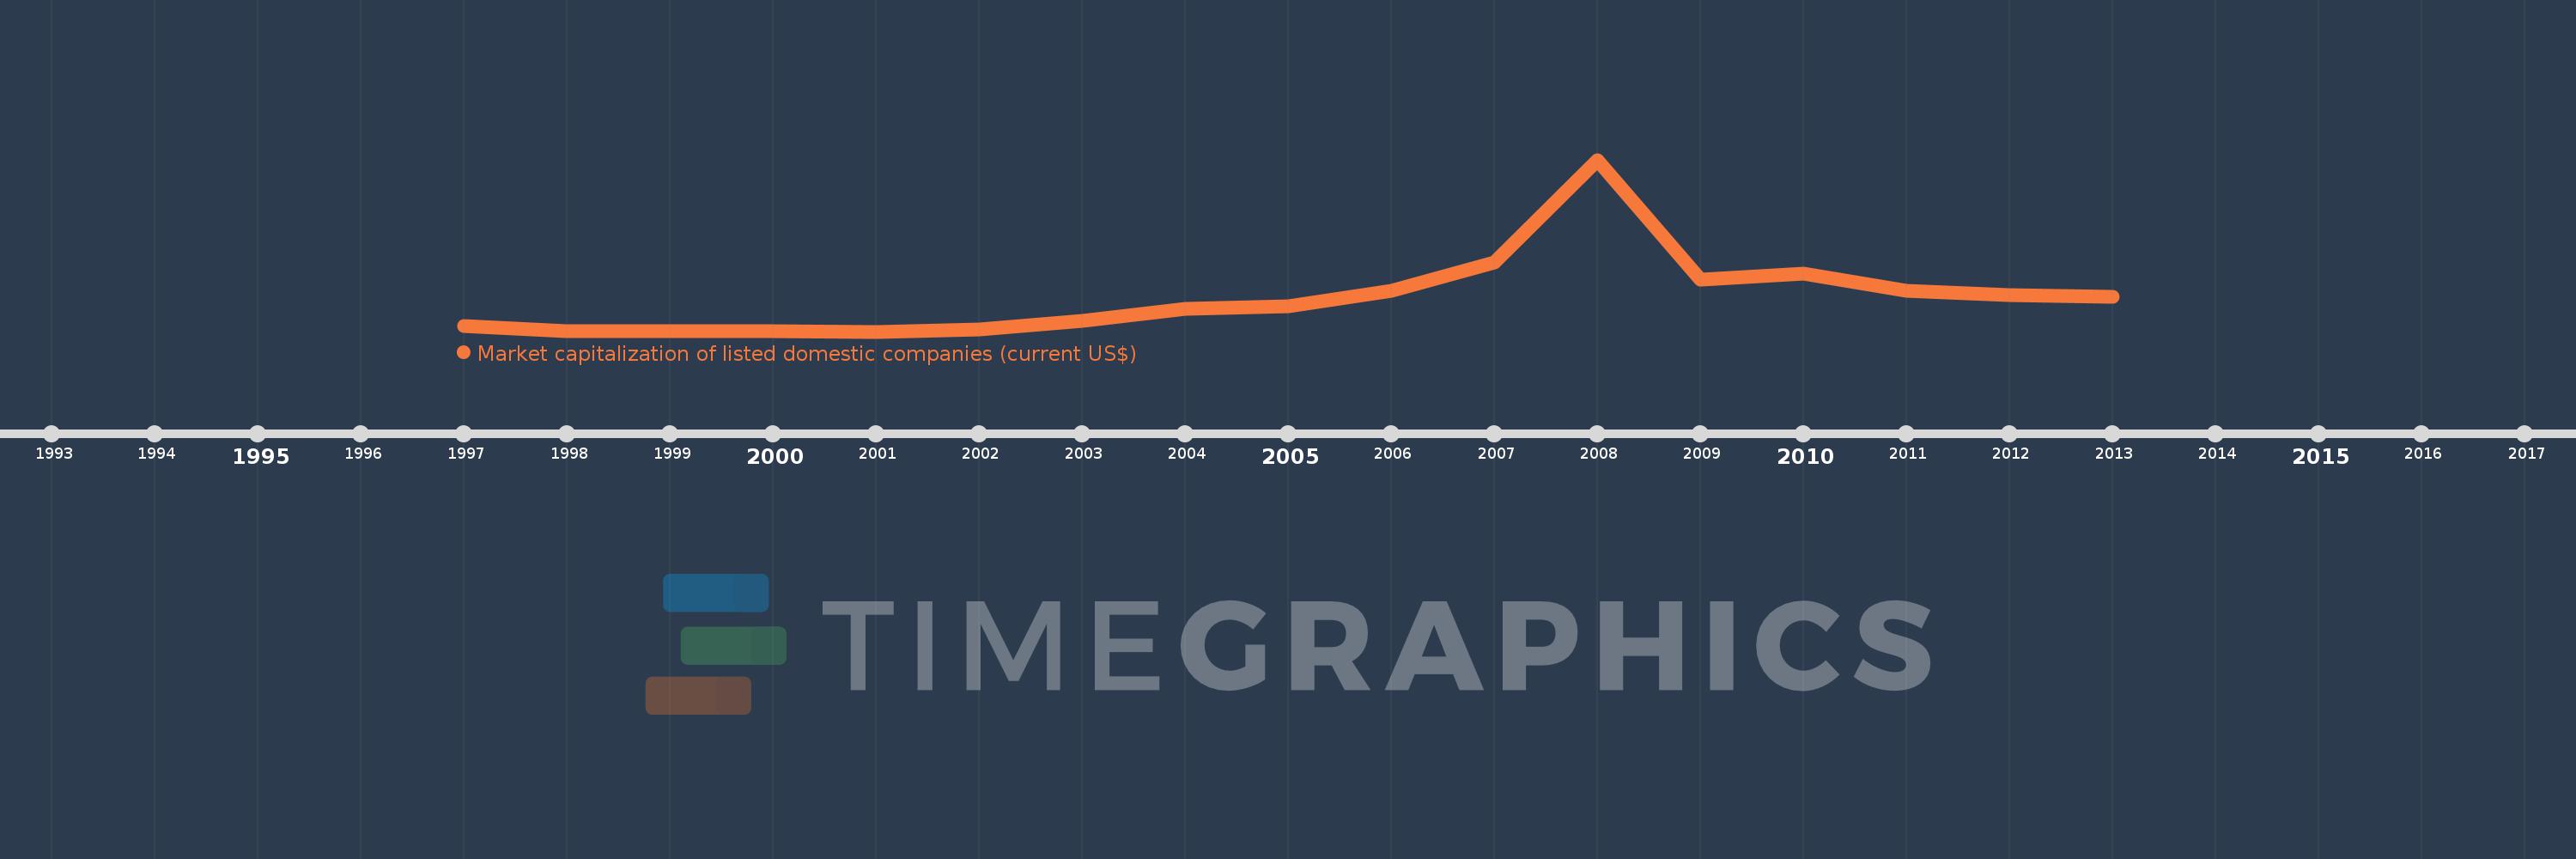
Cette échelle de temps montre un graphique de 1997 année à 2013 année Macedonia, FYR. Les données jusqu'à 1996 année ne sont pas présentés. Quantité d'observations actuelles selon dates: 17.

Source (désignation):

Les indicateurs du développement mondiale

Source (organisation):

World Federation of Exchanges database.

Catégories:

Financial Sector

Dernière mise à jour

23 avr. 2017

Les indicateurs de changement de valeurs selon les années

En moyenne:
536.862 mln.
Minimum:
7.1 mln.
1 janv. 2001
Maximum:
2.715 mds
1 janv. 2008
Pour la date d''observation
Valeur
Changement absolu
Le changement par rapport à la valeur précédente
1 janv. 1997
98.0 mln.
+98.0 mln.
0.0%
1 janv. 1998
8.0 mln.
-90.0 mln.
-91.84%
1 janv. 1999
8.0 mln.
0.0
0.0%
1 janv. 2000
7.673 mln.
-326.7 milles
-4.08%
1 janv. 2001
7.1 mln.
-573.3 milles
-7.47%
1 janv. 2002
46.0 mln.
+38.9 mln.
547.89%
1 janv. 2003
182.062 mln.
+136.062 mln.
295.79%
1 janv. 2004
361.68 mln.
+179.618 mln.
98.66%
1 janv. 2005
413.138 mln.
+51.458 mln.
14.23%
1 janv. 2006
645.979 mln.
+232.841 mln.
56.36%
1 janv. 2007
1.098 mds
+452.428 mln.
70.04%
1 janv. 2008
2.715 mds
+1.617 mds
147.2%
1 janv. 2009
823.486 mln.
-1.892 mds
-69.67%
1 janv. 2010
922.204 mln.
+98.719 mln.
11.99%
1 janv. 2011
650.214 mln.
-271.991 mln.
-29.49%
1 janv. 2012
580.357 mln.
-69.856 mln.
-10.74%
1 janv. 2013
559.06 mln.
-21.298 mln.
-3.67%

Classement des pays selon les statistiques actuelles par années