30
/fr/
AIzaSyAYiBZKx7MnpbEhh9jyipgxe19OcubqV5w
April 1, 2024
140659
Ghana
GHA
true
2
1
Market capitalization of listed domestic companies (current US$)
2012,2011,2010,2009,2008,2007,2006,2005,2004,2003,2002,2001,2000,1999,1998,1997,1996,1995,1994
Download
Bibliothèque de statistiques globales →Ghana →

Market capitalization of listed domestic companies (current US$)

Cette statistique dans les autres pays:

Arab WorldArgentinaArmeniaAustraliaAustriaAzerbaijanBahrainBangladeshBarbadosBelgiumBermudaBhutanBoliviaBosnia and HerzegovinaBotswanaBrazilBulgariaCanadaCayman IslandsCentral Europe and the BalticsChannel IslandsChileChinaColombiaCosta RicaCote d'IvoireCroatiaCyprusCzech RepublicDenmarkDominican RepublicEarly-demographic dividendEast Asia & PacificEast Asia & Pacific (excluding high income)East Asia & Pacific (IDA & IBRD countries)EcuadorEgypt, Arab Rep.El SalvadorEuro areaEurope & Central AsiaEurope & Central Asia (excluding high income)Europe & Central Asia (IDA & IBRD countries)European UnionFijiFinlandFranceGeorgiaGermanyGhanaGreeceGuyanaHigh incomeHondurasHong Kong SAR, ChinaHungaryIBRD onlyIDA & IBRD totalIDA blendIndiaIndonesiaIran, Islamic Rep.IrelandIsraelItalyJamaicaJapanJordanKazakhstanKenyaKorea, Dem. People’s Rep.Korea, Rep.KuwaitKyrgyz RepublicLate-demographic dividendLatin America & Caribbean Latin America & Caribbean (excluding high income)Latin America & the Caribbean (IDA & IBRD countries)LebanonLow & middle incomeLower middle incomeLuxembourgMacedonia, FYRMalawiMalaysiaMaltaMauritiusMexicoMiddle East & North AfricaMiddle East & North Africa (excluding high income)Middle East & North Africa (IDA & IBRD countries)Middle incomeMoldovaMongoliaMontenegroMoroccoNamibiaNetherlandsNew ZealandNigeriaNorth AmericaNorwayOECD membersOmanPakistanPanamaPapua New GuineaParaguayPeruPhilippinesPolandPortugalPost-demographic dividendQatarRomaniaRussian FederationSaudi ArabiaSerbiaSingaporeSlovak RepublicSloveniaSouth AfricaSouth AsiaSouth Asia (IDA & IBRD)SpainSri LankaSt. Kitts and NevisSub-Saharan Africa Sub-Saharan Africa (excluding high income)Sub-Saharan Africa (IDA & IBRD countries)SwazilandSwedenSwitzerlandTanzaniaThailandTrinidad and TobagoTunisiaTurkeyUgandaUkraineUnited Arab EmiratesUnited KingdomUnited StatesUpper middle incomeUruguayUzbekistanVenezuela, RBVietnamWest Bank and GazaWorldZambiaZimbabwe

La ligne de temps

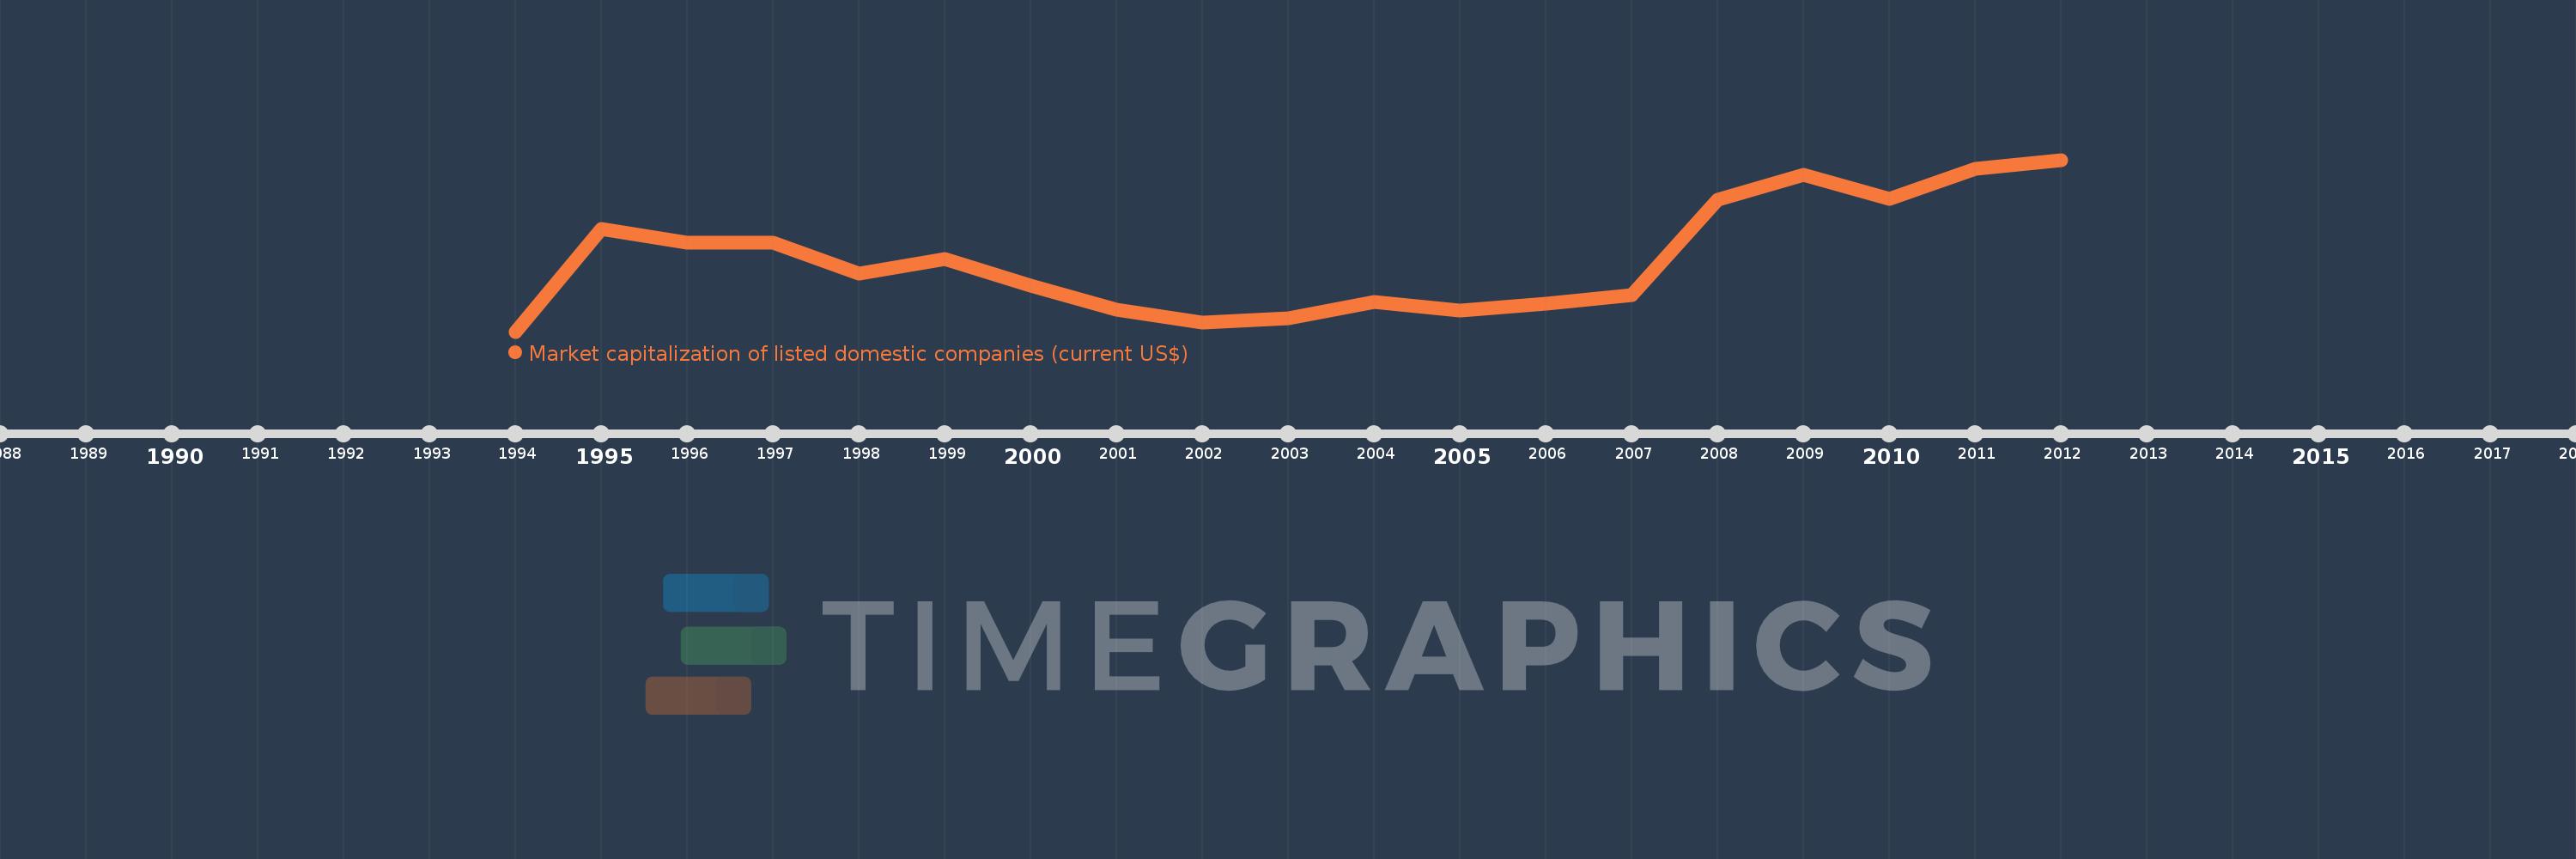
Cette échelle de temps montre un graphique de 1994 année à 2012 année Ghana. Les données jusqu'à 1993 année ne sont pas présentés. Quantité d'observations actuelles selon dates: 19.

Source (désignation):

Les indicateurs du développement mondiale

Source (organisation):

World Federation of Exchanges database.

Catégories:

Financial Sector

Dernière mise à jour

23 avr. 2017

Les indicateurs de changement de valeurs selon les années

En moyenne:
1.375 mds
Minimum:
122.1 mln.
1 janv. 1994
Maximum:
3.099 mds
1 janv. 2012
Pour la date d''observation
Valeur
Changement absolu
Le changement par rapport à la valeur précédente
1 janv. 1994
122.1 mln.
+122.1 mln.
0.0%
1 janv. 1995
1.899 mds
+1.777 mds
1.46 milles%
1 janv. 1996
1.668 mds
-231.1 mln.
-12.17%
1 janv. 1997
1.659 mds
-9.71 mln.
-0.58%
1 janv. 1998
1.13 mds
-529.04 mln.
-31.9%
1 janv. 1999
1.387 mds
+257.46 mln.
22.79%
1 janv. 2000
920.0 mln.
-467.01 mln.
-33.67%
1 janv. 2001
500.0 mln.
-420.0 mln.
-45.65%
1 janv. 2002
280.0 mln.
-220.0 mln.
-44.0%
1 janv. 2003
350.0 mln.
+70.0 mln.
25.0%
1 janv. 2004
640.0 mln.
+290.0 mln.
82.86%
1 janv. 2005
480.0 mln.
-160.0 mln.
-25.0%
1 janv. 2006
610.0 mln.
+130.0 mln.
27.08%
1 janv. 2007
760.0 mln.
+150.0 mln.
24.59%
1 janv. 2008
2.401 mds
+1.641 mds
215.96%
1 janv. 2009
2.844 mds
+443.09 mln.
18.45%
1 janv. 2010
2.427 mds
-417.36 mln.
-14.67%
1 janv. 2011
2.948 mds
+520.67 mln.
21.45%
1 janv. 2012
3.099 mds
+150.82 mln.
5.12%

Classement des pays selon les statistiques actuelles par années