33
/es/
AIzaSyAYiBZKx7MnpbEhh9jyipgxe19OcubqV5w
May 1, 2025
95966
Burundi
BDI
true
2
1
Current education expenditure, primary (% of total expenditure in primary public institutions)
2013,2012,2011,2010,2009,2005,2003,2002,2000
Download
Estadísticas Globales de la Biblioteca →Burundi →

Current education expenditure, primary (% of total expenditure in primary public institutions)

Estas estadísticas en otros países:

AlgeriaAndorraAngolaAntigua and BarbudaArgentinaArmeniaArubaAustraliaAustriaBahrainBangladeshBarbadosBelarusBelgiumBelizeBeninBhutanBoliviaBotswanaBrazilBritish Virgin IslandsBulgariaBurkina FasoBurundiCabo VerdeCambodiaCameroonCanadaCaribbean small statesCayman IslandsCentral African RepublicCentral Europe and the BalticsChadChileChinaColombiaComorosCongo, Dem. Rep.Costa RicaCote d'IvoireCubaCuracaoCyprusCzech RepublicDenmarkDjiboutiDominicaDominican RepublicEast Asia & PacificEast Asia & Pacific (IDA & IBRD countries)EcuadorEl SalvadorEritreaEstoniaEthiopiaEuro areaEurope & Central AsiaEuropean UnionFinlandFranceGambia, TheGermanyGhanaGrenadaGuatemalaGuineaGuinea-BissauGuyanaHeavily indebted poor countries (HIPC)High incomeHondurasHong Kong SAR, ChinaHungaryIcelandIDA blendIndiaIndonesiaIran, Islamic Rep.IrelandIsraelItalyJamaicaJapanJordanKazakhstanKorea, Rep.KuwaitLate-demographic dividendLatin America & Caribbean Latin America & Caribbean (excluding high income)Latin America & the Caribbean (IDA & IBRD countries)LatviaLesothoLiechtensteinLithuaniaLow incomeLuxembourgMacao SAR, ChinaMadagascarMalawiMalaysiaMaliMaltaMarshall IslandsMauritaniaMauritiusMexicoMoldovaMonacoMongoliaMoroccoMozambiqueNamibiaNetherlandsNicaraguaNigerNorth AmericaNorwayOECD membersOmanPakistanPanamaParaguayPeruPhilippinesPolandPortugalPost-demographic dividendPre-demographic dividendPuerto RicoRomaniaRwandaSan MarinoSao Tome and PrincipeSenegalSerbiaSeychellesSierra LeoneSingaporeSlovak RepublicSloveniaSouth AfricaSpainSri LankaSt. Kitts and NevisSt. LuciaSt. Vincent and the GrenadinesSub-Saharan Africa Sub-Saharan Africa (excluding high income)Sub-Saharan Africa (IDA & IBRD countries)SwedenSwitzerlandSyrian Arab RepublicThailandTimor-LesteTogoTunisiaTurkeyTurks and Caicos IslandsUgandaUkraineUnited Arab EmiratesUnited KingdomUnited StatesUruguayVanuatuVenezuela, RBVietnamYemen, Rep.Zambia

línea de tiempo (timeline):

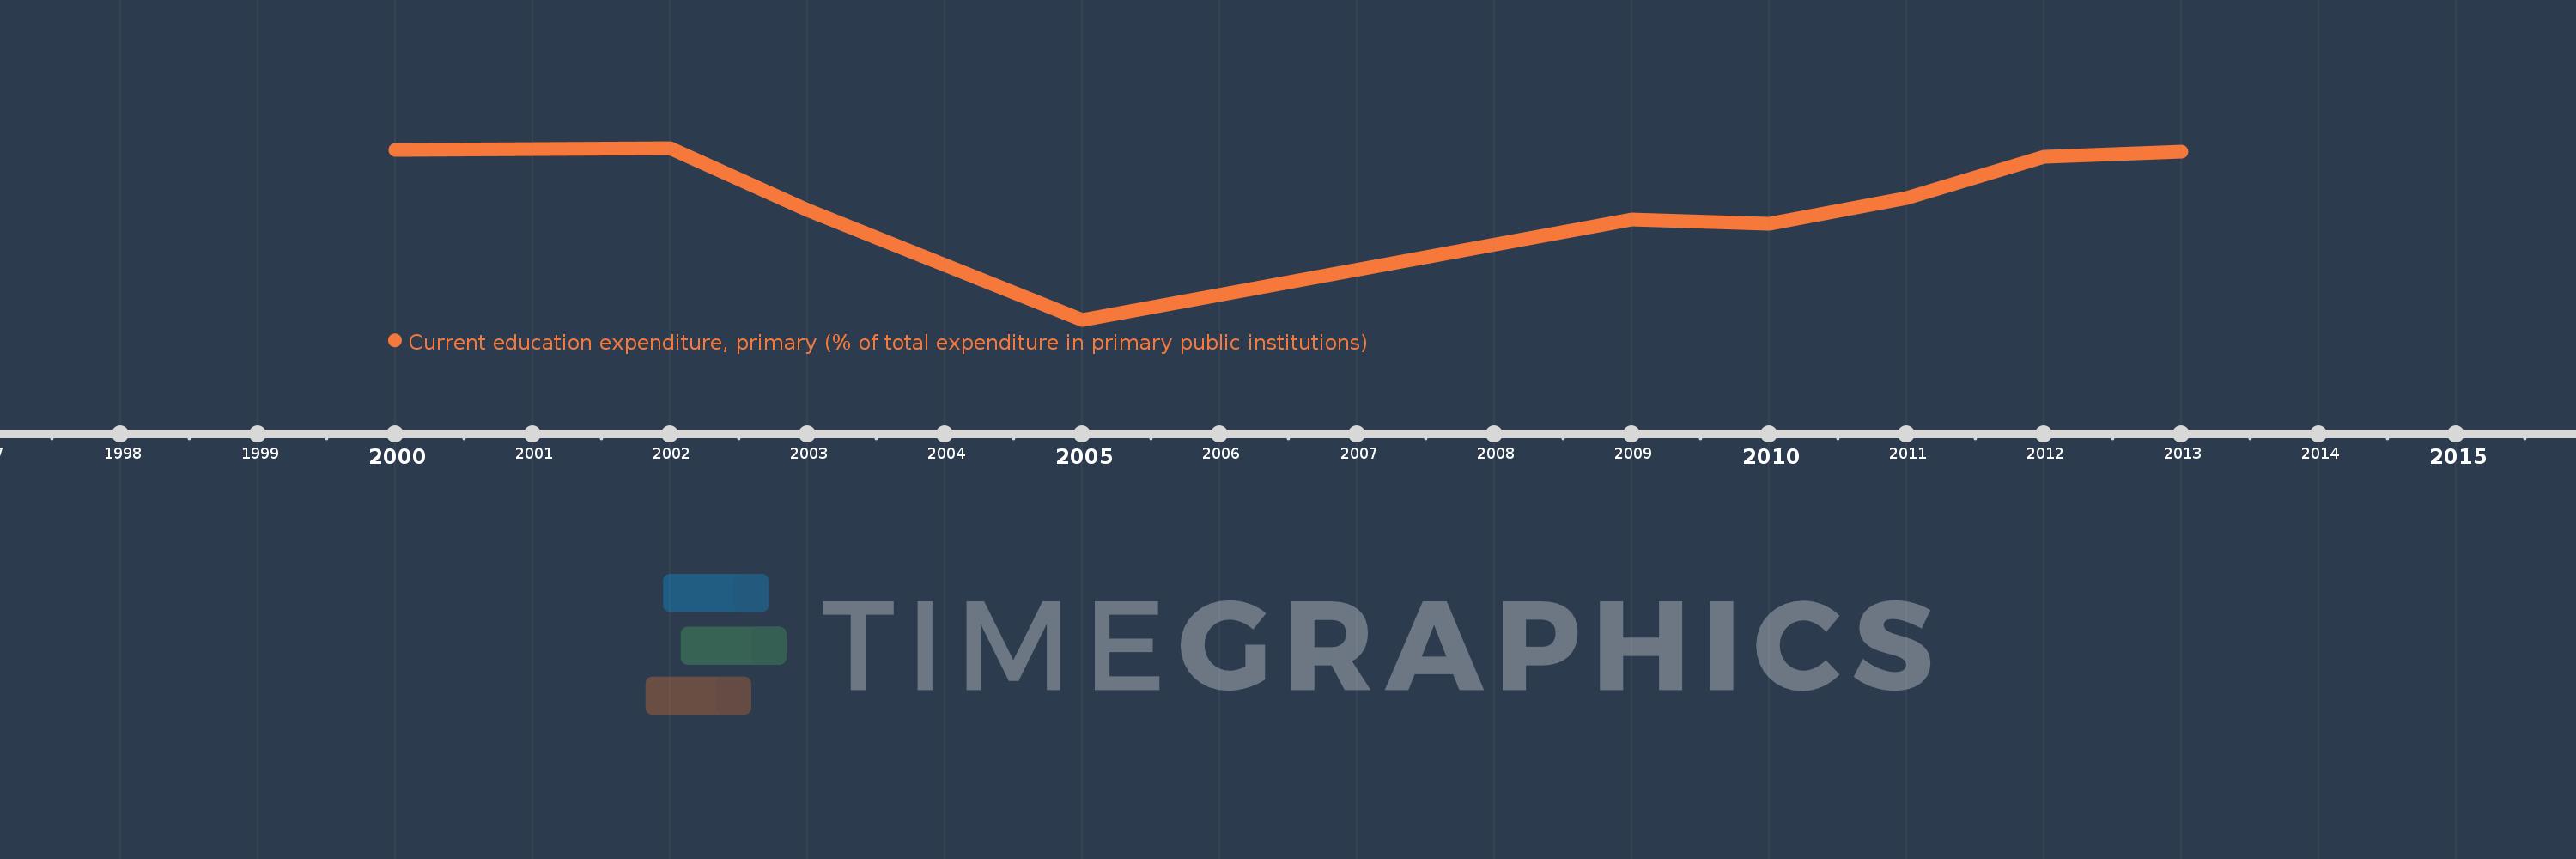
En esta escala de tiempo se presenta un gráfico de 2000 y 2013 de Burundi. Los datos de 1999 están ausentes. El número de observaciones reales por fecha: 9.

Fuente (nombre):

Indicadores del desarrollo mundial

Fuente (organización):

United Nations Educational, Scientific, and Cultural Organization (UNESCO) Institute for Statistics.

Categorías:

Education

Se ha actualizado:

23 abr 2017 año

Los indicadores de los cambios de valor en los últimos años

En promedio:
88.149
Mínimo:
64.347
1 ene 2005 año
Máximo:
97.774
1 ene 2002 año
A la fecha de observación
Valor
Cambio absoluto
El cambio con respecto al valor anterior
1 ene 2000 año
97.428
+97.428
0.0%
1 ene 2002 año
97.774
+0.346
0.36%
1 ene 2003 año
85.771
-12.003
-12.28%
1 ene 2005 año
64.347
-21.424
-24.98%
1 ene 2009 año
83.788
+19.441
30.21%
1 ene 2010 año
83.074
-0.714
-0.85%
1 ene 2011 año
88.088
+5.014
6.04%
1 ene 2012 año
95.996
+7.907
8.98%
1 ene 2013 año
97.071
+1.075
1.12%

Ranking de los países por los datos estadísticos actuales