33
/es/
AIzaSyAYiBZKx7MnpbEhh9jyipgxe19OcubqV5w
August 1, 2025
90957
Brazil
BRA
true
2
1
Current education expenditure, primary (% of total expenditure in primary public institutions)
2014,2013,2012,2011,2010,2009,2008,2007,2006,2005,2003,2002,2001,2000,1999
Download
Estadísticas Globales de la Biblioteca →Brazil →

Current education expenditure, primary (% of total expenditure in primary public institutions)

Estas estadísticas en otros países:

AlgeriaAndorraAngolaAntigua and BarbudaArgentinaArmeniaArubaAustraliaAustriaBahrainBangladeshBarbadosBelarusBelgiumBelizeBeninBhutanBoliviaBotswanaBrazilBritish Virgin IslandsBulgariaBurkina FasoBurundiCabo VerdeCambodiaCameroonCanadaCaribbean small statesCayman IslandsCentral African RepublicCentral Europe and the BalticsChadChileChinaColombiaComorosCongo, Dem. Rep.Costa RicaCote d'IvoireCubaCuracaoCyprusCzech RepublicDenmarkDjiboutiDominicaDominican RepublicEast Asia & PacificEast Asia & Pacific (IDA & IBRD countries)EcuadorEl SalvadorEritreaEstoniaEthiopiaEuro areaEurope & Central AsiaEuropean UnionFinlandFranceGambia, TheGermanyGhanaGrenadaGuatemalaGuineaGuinea-BissauGuyanaHeavily indebted poor countries (HIPC)High incomeHondurasHong Kong SAR, ChinaHungaryIcelandIDA blendIndiaIndonesiaIran, Islamic Rep.IrelandIsraelItalyJamaicaJapanJordanKazakhstanKorea, Rep.KuwaitLate-demographic dividendLatin America & Caribbean Latin America & Caribbean (excluding high income)Latin America & the Caribbean (IDA & IBRD countries)LatviaLesothoLiechtensteinLithuaniaLow incomeLuxembourgMacao SAR, ChinaMadagascarMalawiMalaysiaMaliMaltaMarshall IslandsMauritaniaMauritiusMexicoMoldovaMonacoMongoliaMoroccoMozambiqueNamibiaNetherlandsNicaraguaNigerNorth AmericaNorwayOECD membersOmanPakistanPanamaParaguayPeruPhilippinesPolandPortugalPost-demographic dividendPre-demographic dividendPuerto RicoRomaniaRwandaSan MarinoSao Tome and PrincipeSenegalSerbiaSeychellesSierra LeoneSingaporeSlovak RepublicSloveniaSouth AfricaSpainSri LankaSt. Kitts and NevisSt. LuciaSt. Vincent and the GrenadinesSub-Saharan Africa Sub-Saharan Africa (excluding high income)Sub-Saharan Africa (IDA & IBRD countries)SwedenSwitzerlandSyrian Arab RepublicThailandTimor-LesteTogoTunisiaTurkeyTurks and Caicos IslandsUgandaUkraineUnited Arab EmiratesUnited KingdomUnited StatesUruguayVanuatuVenezuela, RBVietnamYemen, Rep.Zambia

línea de tiempo (timeline):

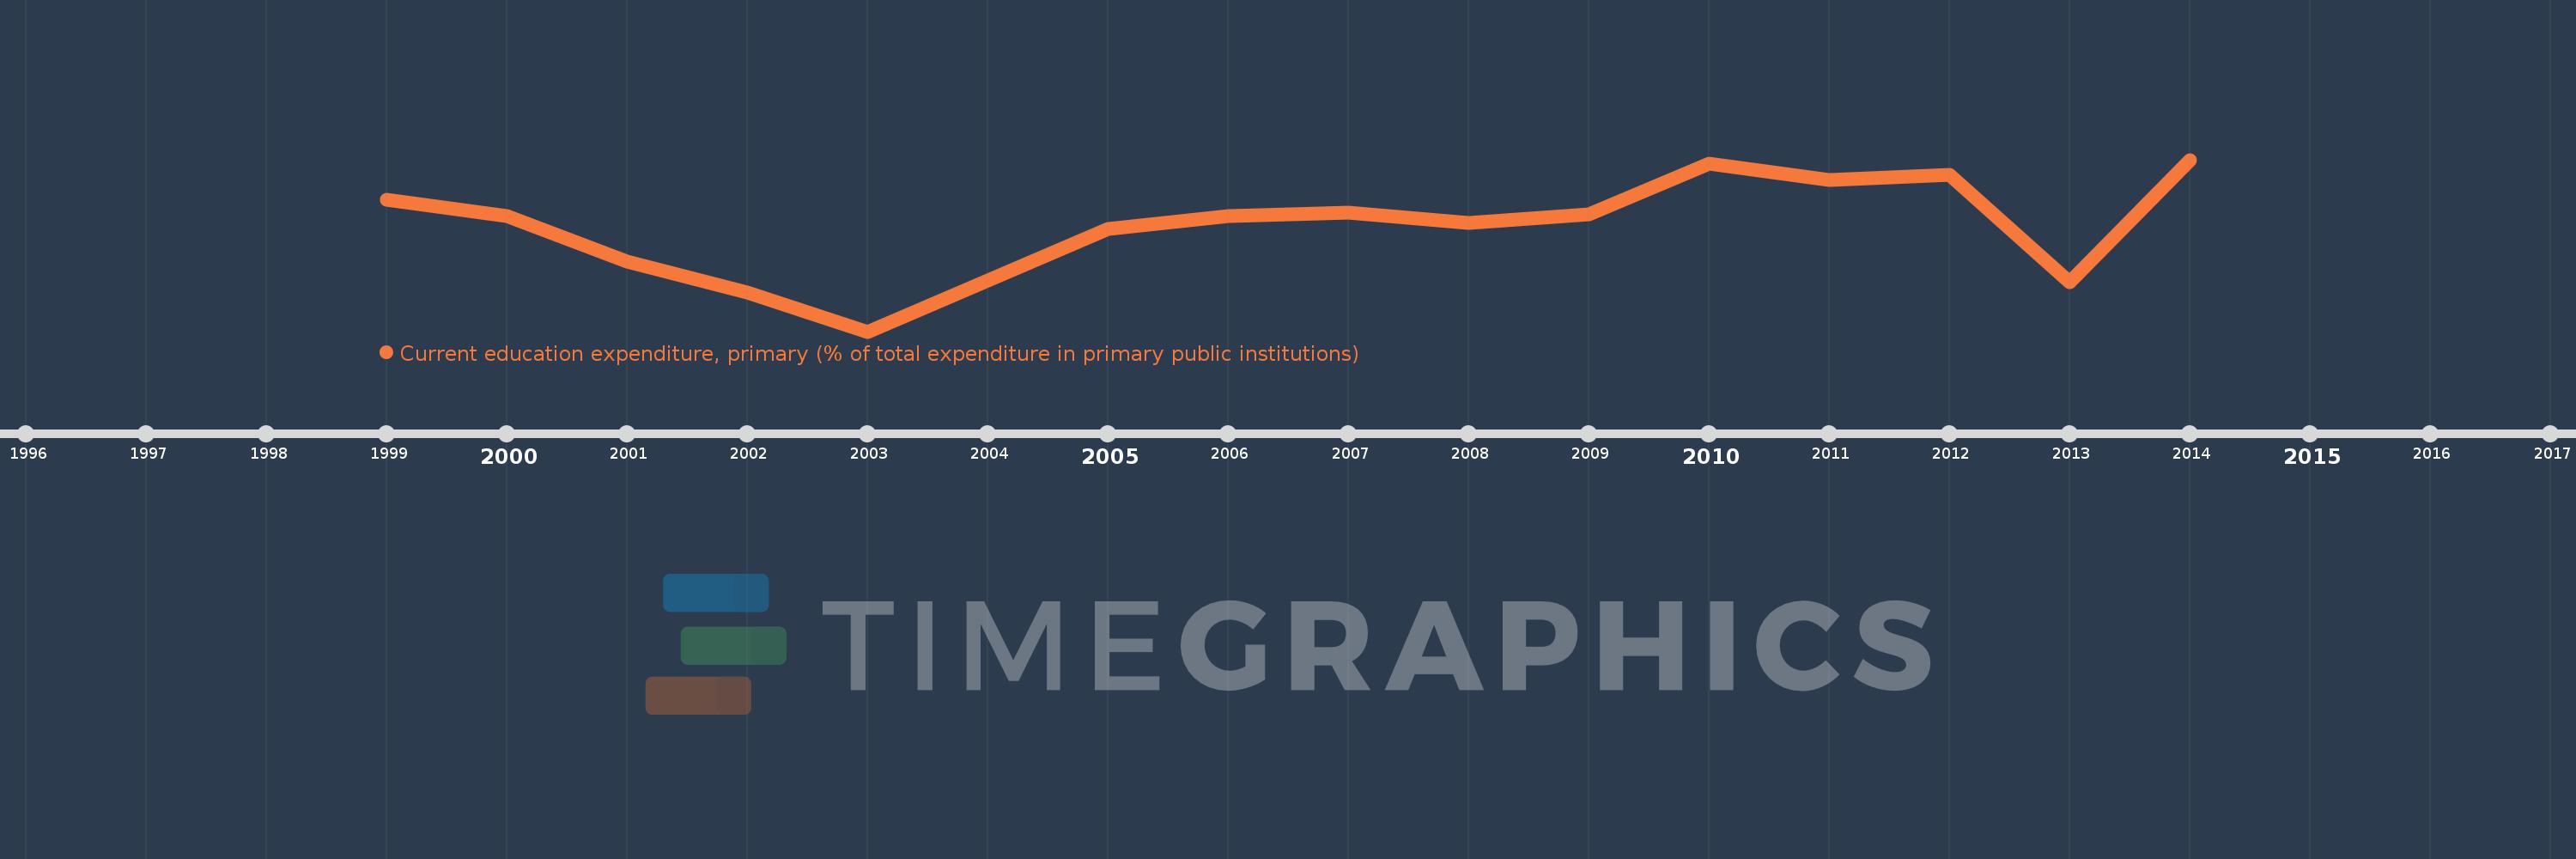
En esta escala de tiempo se presenta un gráfico de 1999 y 2014 de Brazil. Los datos de 1998 están ausentes. El número de observaciones reales por fecha: 15.

Fuente (nombre):

Indicadores del desarrollo mundial

Fuente (organización):

United Nations Educational, Scientific, and Cultural Organization (UNESCO) Institute for Statistics.

Categorías:

Education

Se ha actualizado:

23 abr 2017 año

Los indicadores de los cambios de valor en los últimos años

En promedio:
92.961
Mínimo:
90.003
1 ene 2003 año
Máximo:
94.719
1 ene 2014 año
A la fecha de observación
Valor
Cambio absoluto
El cambio con respecto al valor anterior
1 ene 1999 año
93.611
+93.611
0.0%
1 ene 2000 año
93.175
-0.436
-0.47%
1 ene 2001 año
91.917
-1.259
-1.35%
1 ene 2002 año
91.078
-0.839
-0.91%
1 ene 2003 año
90.003
-1.075
-1.18%
1 ene 2005 año
92.831
+2.828
3.14%
1 ene 2006 año
93.174
+0.343
0.37%
1 ene 2007 año
93.266
+0.091
0.1%
1 ene 2008 año
92.985
-0.281
-0.3%
1 ene 2009 año
93.221
+0.237
0.25%
1 ene 2010 año
94.604
+1.383
1.48%
1 ene 2011 año
94.158
-0.447
-0.47%
1 ene 2012 año
94.317
+0.16
0.17%
1 ene 2013 año
91.351
-2.966
-3.14%
1 ene 2014 año
94.719
+3.368
3.69%

Ranking de los países por los datos estadísticos actuales