29
/es/
es
AIzaSyAYiBZKx7MnpbEhh9jyipgxe19OcubqV5w
April 1, 2024
264424
Togo
TGO
true
2
1
Current education expenditure, primary (% of total expenditure in primary public institutions)
2015,2014,2013,2012,2011,2010,2009,2008,2001,2000,1999
Download
Estadísticas Globales de la Biblioteca →Togo →

Current education expenditure, primary (% of total expenditure in primary public institutions)

Estas estadísticas en otros países:
AlgeriaAndorraAngolaAntigua and BarbudaArgentinaArmeniaArubaAustraliaAustriaBahrainBangladeshBarbadosBelarusBelgiumBelizeBeninBhutanBoliviaBotswanaBrazilBritish Virgin IslandsBulgariaBurkina FasoBurundiCabo VerdeCambodiaCameroonCanadaCaribbean small statesCayman IslandsCentral African RepublicCentral Europe and the BalticsChadChileChinaColombiaComorosCongo, Dem. Rep.Costa RicaCote d'IvoireCubaCuracaoCyprusCzech RepublicDenmarkDjiboutiDominicaDominican RepublicEast Asia & PacificEast Asia & Pacific (IDA & IBRD countries)EcuadorEl SalvadorEritreaEstoniaEthiopiaEuro areaEurope & Central AsiaEuropean UnionFinlandFranceGambia, TheGermanyGhanaGrenadaGuatemalaGuineaGuinea-BissauGuyanaHeavily indebted poor countries (HIPC)High incomeHondurasHong Kong SAR, ChinaHungaryIcelandIDA blendIndiaIndonesiaIran, Islamic Rep.IrelandIsraelItalyJamaicaJapanJordanKazakhstanKorea, Rep.KuwaitLate-demographic dividendLatin America & Caribbean Latin America & Caribbean (excluding high income)Latin America & the Caribbean (IDA & IBRD countries)LatviaLesothoLiechtensteinLithuaniaLow incomeLuxembourgMacao SAR, ChinaMadagascarMalawiMalaysiaMaliMaltaMarshall IslandsMauritaniaMauritiusMexicoMoldovaMonacoMongoliaMoroccoMozambiqueNamibiaNetherlandsNicaraguaNigerNorth AmericaNorwayOECD membersOmanPakistanPanamaParaguayPeruPhilippinesPolandPortugalPost-demographic dividendPre-demographic dividendPuerto RicoRomaniaRwandaSan MarinoSao Tome and PrincipeSenegalSerbiaSeychellesSierra LeoneSingaporeSlovak RepublicSloveniaSouth AfricaSpainSri LankaSt. Kitts and NevisSt. LuciaSt. Vincent and the GrenadinesSub-Saharan Africa Sub-Saharan Africa (excluding high income)Sub-Saharan Africa (IDA & IBRD countries)SwedenSwitzerlandSyrian Arab RepublicThailandTimor-LesteTogoTunisiaTurkeyTurks and Caicos IslandsUgandaUkraineUnited Arab EmiratesUnited KingdomUnited StatesUruguayVanuatuVenezuela, RBVietnamYemen, Rep.Zambia
línea de tiempo (timeline):
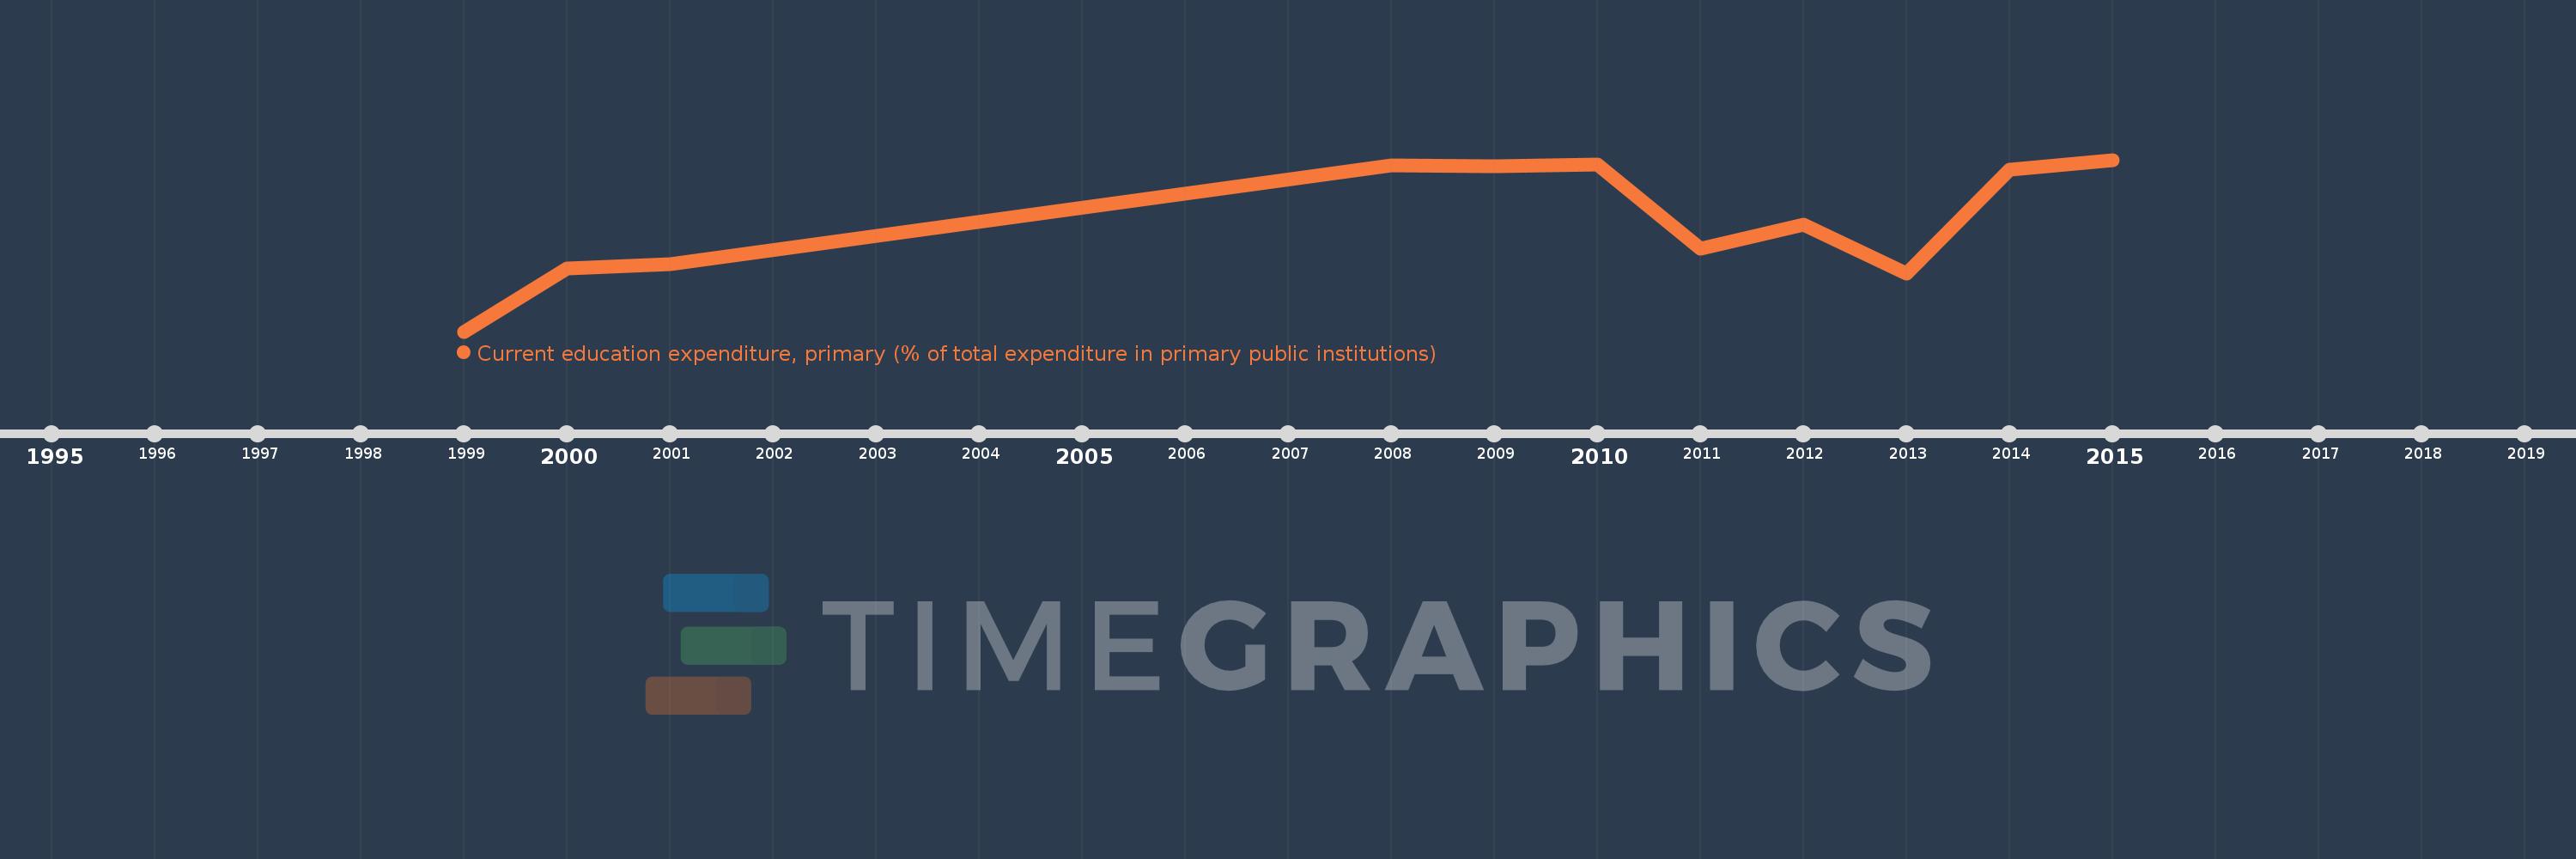
En esta escala de tiempo se presenta un gráfico de 1999 y 2015 de Togo. Los datos de 1998 están ausentes. El número de observaciones reales por fecha: 11.
Fuente (nombre):
Indicadores del desarrollo mundial
Fuente (organización):
United Nations Educational, Scientific, and Cultural Organization (UNESCO) Institute for Statistics.
Categorías:
Education
Se ha actualizado:
23 abr 2017 año
Los indicadores de los cambios de valor en los últimos años
En promedio:
89.43
Mínimo:
71.382
1 ene 1999 año
Máximo:
99.587
1 ene 2015 año
A la fecha de observación
Valor
Cambio absoluto
El cambio con respecto al valor anterior
1 ene 1999 año
71.382
+71.382
0.0%
1 ene 2000 año
81.68
+10.299
14.43%
1 ene 2001 año
82.521
+0.841
1.03%
1 ene 2008 año
98.627
+16.105
19.52%
1 ene 2009 año
98.46
-0.167
-0.17%
1 ene 2010 año
98.775
+0.315
0.32%
1 ene 2011 año
84.999
-13.777
-13.95%
1 ene 2012 año
88.927
+3.928
4.62%
1 ene 2013 año
80.845
-8.082
-9.09%
1 ene 2014 año
97.932
+17.087
21.14%
1 ene 2015 año
99.587
+1.655
1.69%
Ranking de los países por los datos estadísticos actuales

Comentarios:

Enviar
PremiumAbout & FeedbackAcuerdoPrivacidad
logo
© 2022 Selected Technologies LLC – Morgan Hill, California