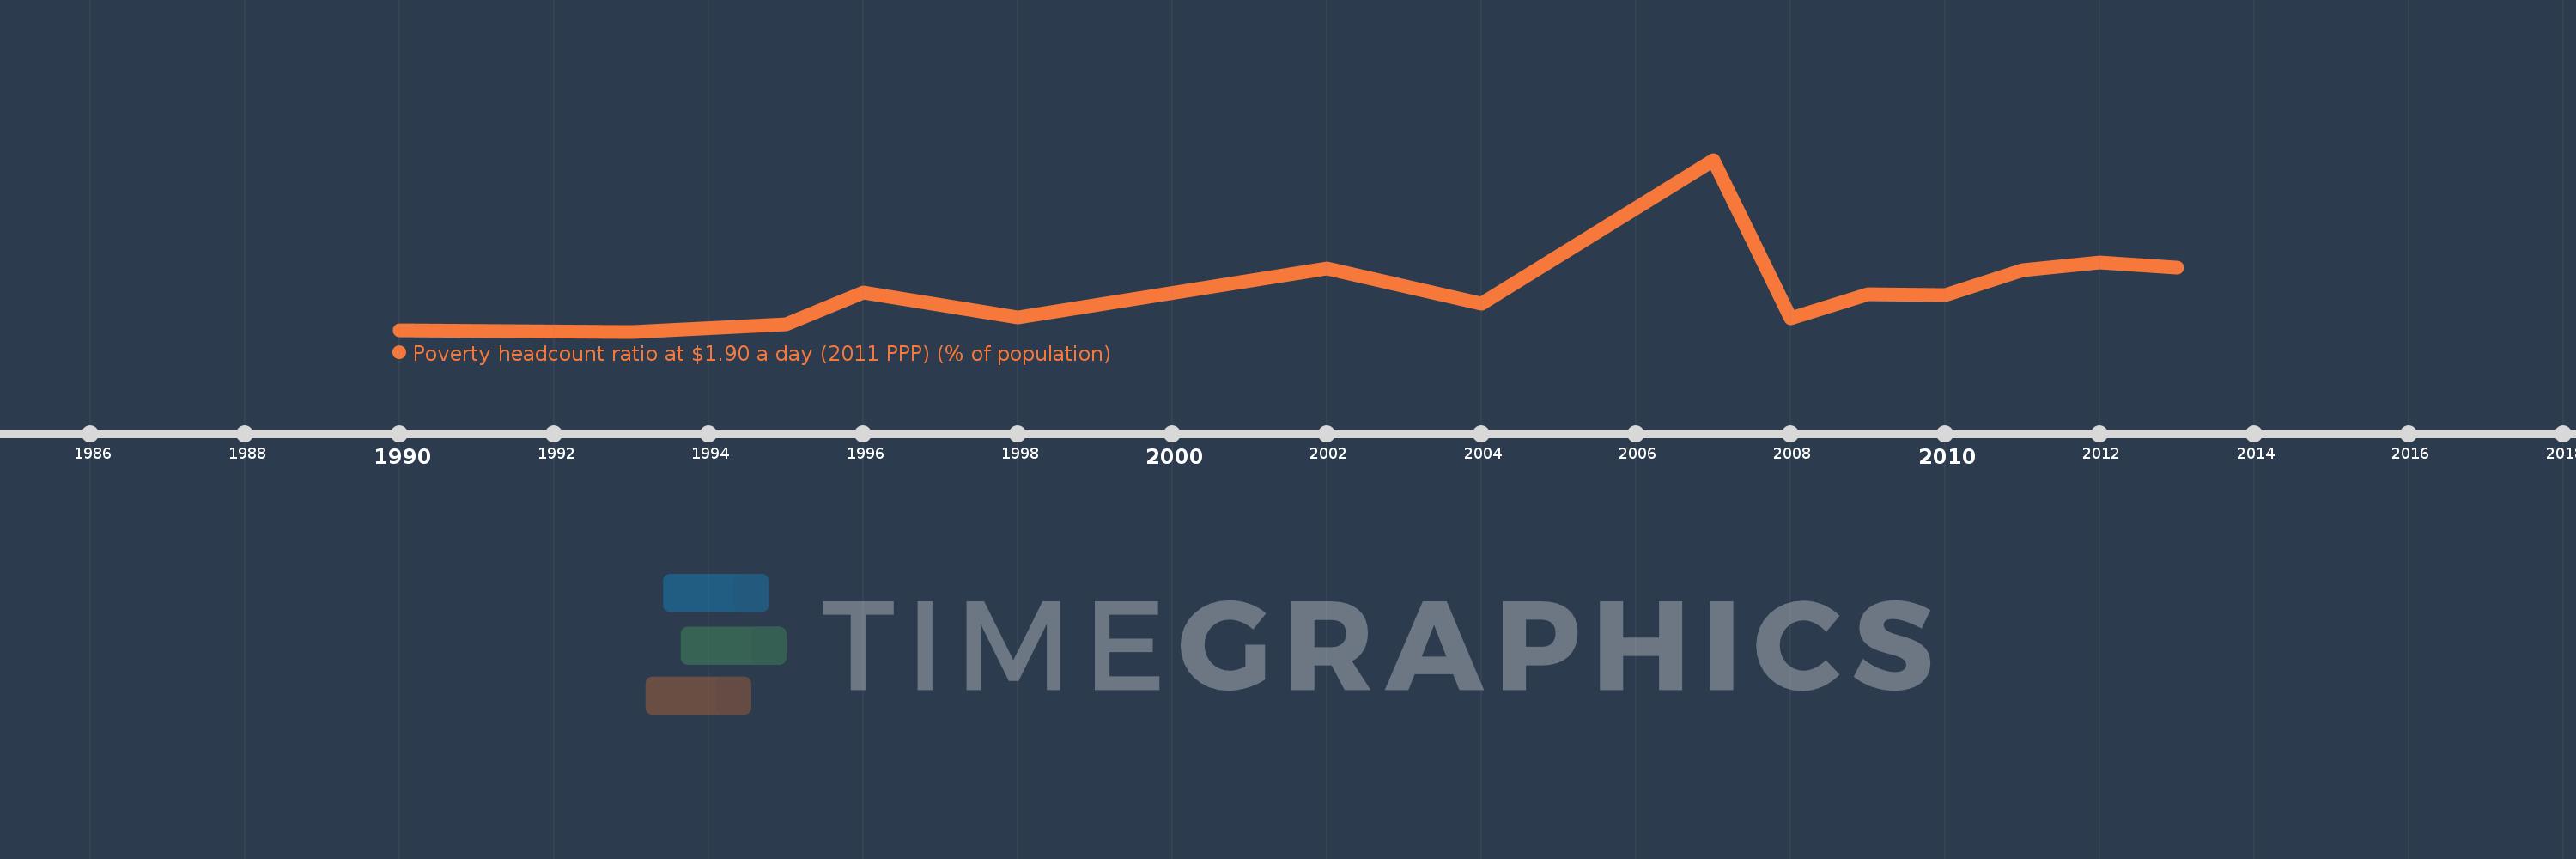
En esta escala de tiempo se presenta un gráfico de 1990 y 2013 de Bulgaria. Los datos de 1989 están ausentes. El número de observaciones reales por fecha: 14.
Fuente (nombre):
Indicadores del desarrollo mundial
Fuente (organización):
World Bank, Development Research Group. Data are based on primary household survey data obtained from government statistical agencies and World Bank country departments. Data for high-income economies are from the Luxembourg Income Study database. For more information and methodology, please see PovcalNet (http://iresearch.worldbank.org/PovcalNet/index.htm).
Categorías:
Poverty, Aid Effectiveness, Climate Change
Se ha actualizado:
23 abr 2017 año
Los indicadores de los cambios de valor en los últimos años
En promedio:
1.369
Mínimo:
0.0
1 ene 1993 año
Máximo:
5.42
1 ene 2007 año
A la fecha de observación
Valor
Cambio absoluto
El cambio con respecto al valor anterior
1 ene 1990 año
0.05
+0.05
0.0%
1 ene 1993 año
0.0
-0.05
-100.0%
1 ene 1995 año
0.24
+0.24
%
1 ene 1996 año
1.23
+0.99
412.5%
1 ene 1998 año
0.45
-0.78
-63.41%
1 ene 2002 año
2.0
+1.55
344.44%
1 ene 2004 año
0.88
-1.12
-56.0%
1 ene 2007 año
5.42
+4.54
515.91%
1 ene 2008 año
0.42
-5.0
-92.25%
1 ene 2009 año
1.18
+0.76
180.95%
1 ene 2010 año
1.15
-0.03
-2.54%
1 ene 2011 año
1.93
+0.78
67.83%
1 ene 2012 año
2.19
+0.26
13.47%
1 ene 2013 año
2.03
-0.16
-7.31%
Ranking de los países por los datos estadísticos actuales