Download Estas estadísticas en otros países:
línea de tiempo (timeline):
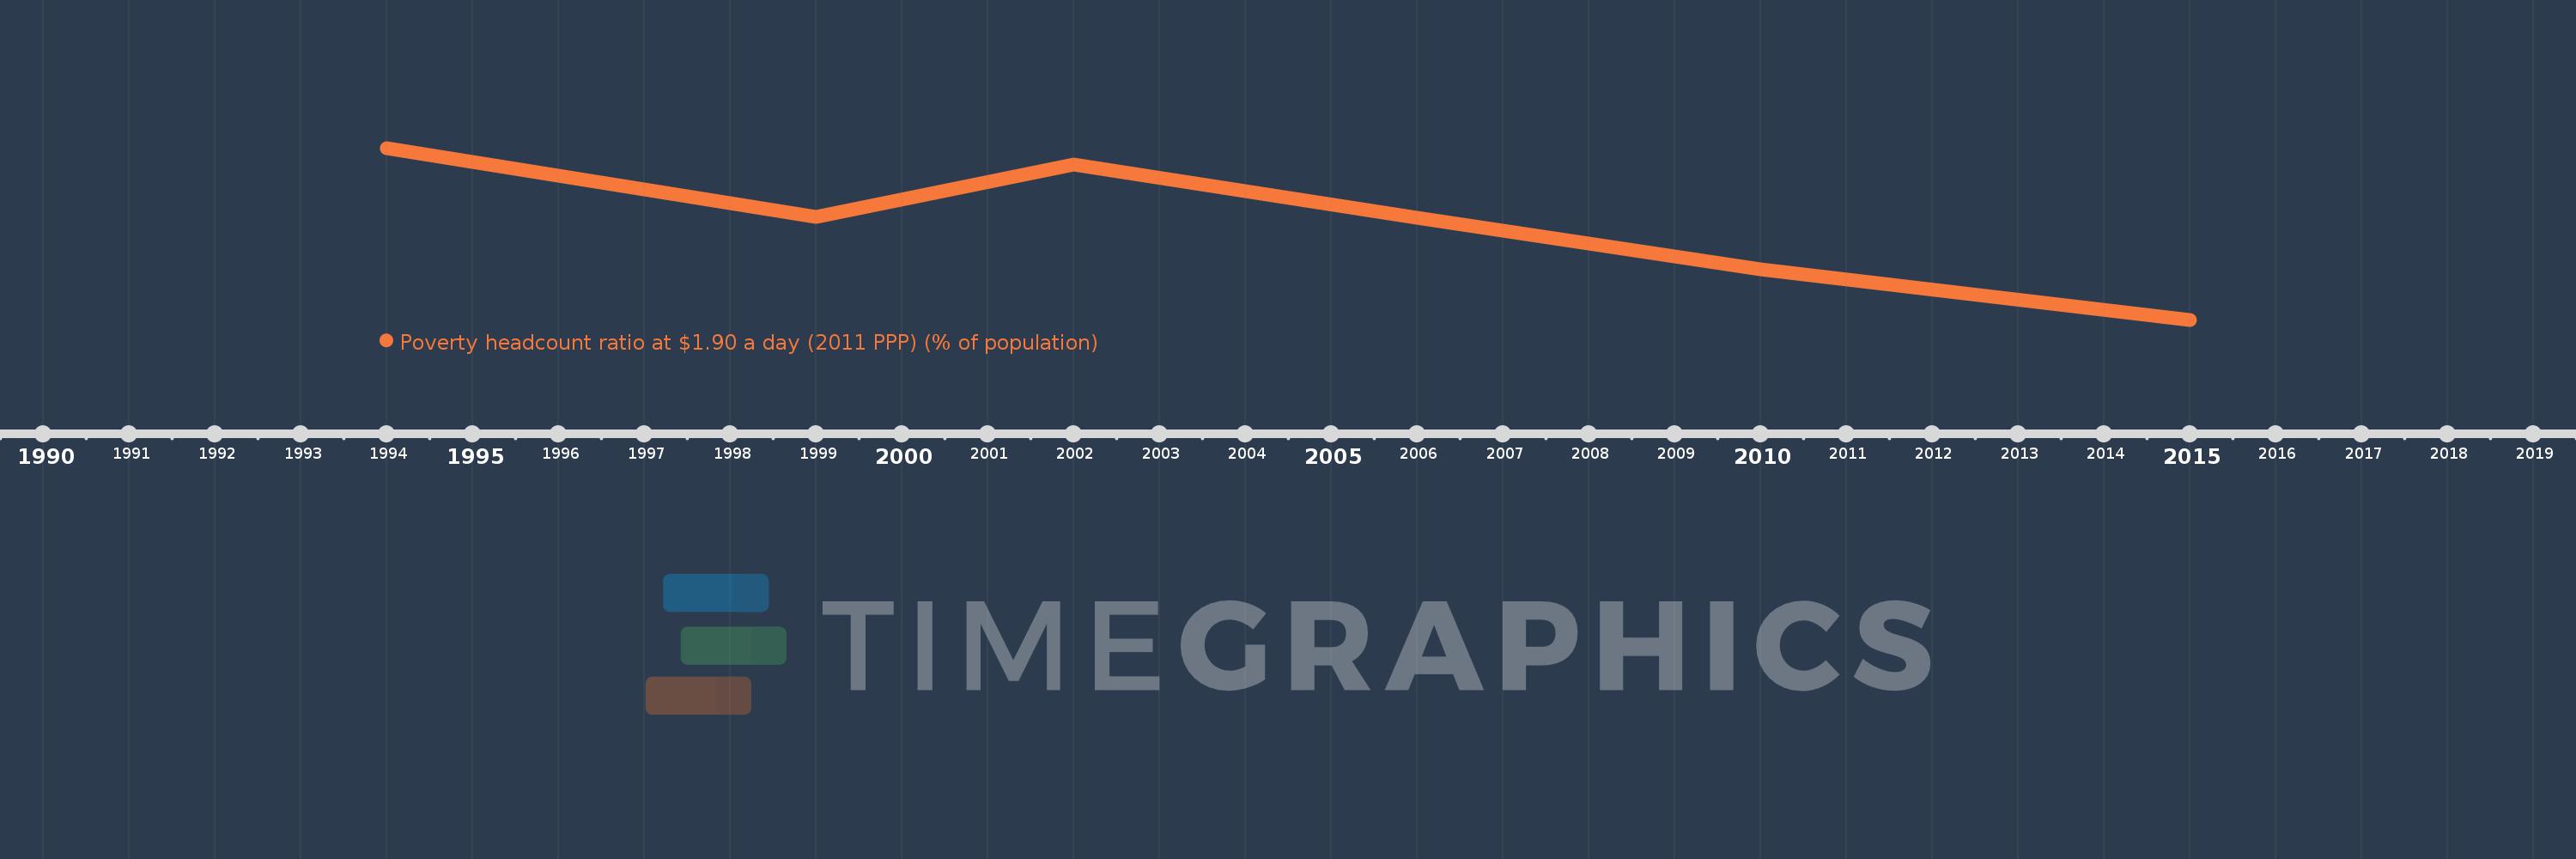
En esta escala de tiempo se presenta un gráfico de 1994 y 2015 de Nicaragua. Los datos de 1993 están ausentes. El número de observaciones reales por fecha: 6.
Fuente (nombre):
Indicadores del desarrollo mundial
Fuente (organización):
World Bank, Development Research Group. Data are based on primary household survey data obtained from government statistical agencies and World Bank country departments. Data for high-income economies are from the Luxembourg Income Study database. For more information and methodology, please see PovcalNet (http://iresearch.worldbank.org/PovcalNet/index.htm).
Categorías:
Poverty, Aid Effectiveness, Climate Change
Se ha actualizado:
23 abr 2017 año
Los indicadores de los cambios de valor en los últimos años
Mínimo:
6.22
1 ene 2015 año
Máximo:
22.06
1 ene 1994 año
A la fecha de observación
Valor
Cambio absoluto
El cambio con respecto al valor anterior
1 ene 1994 año
22.06
+22.06
0.0%
1 ene 1999 año
15.67
-6.39
-28.97%
1 ene 2002 año
20.52
+4.85
30.95%
1 ene 2006 año
15.6
-4.92
-23.98%
1 ene 2010 año
10.83
-4.77
-30.58%
1 ene 2015 año
6.22
-4.61
-42.57%
Ranking de los países por los datos estadísticos actuales