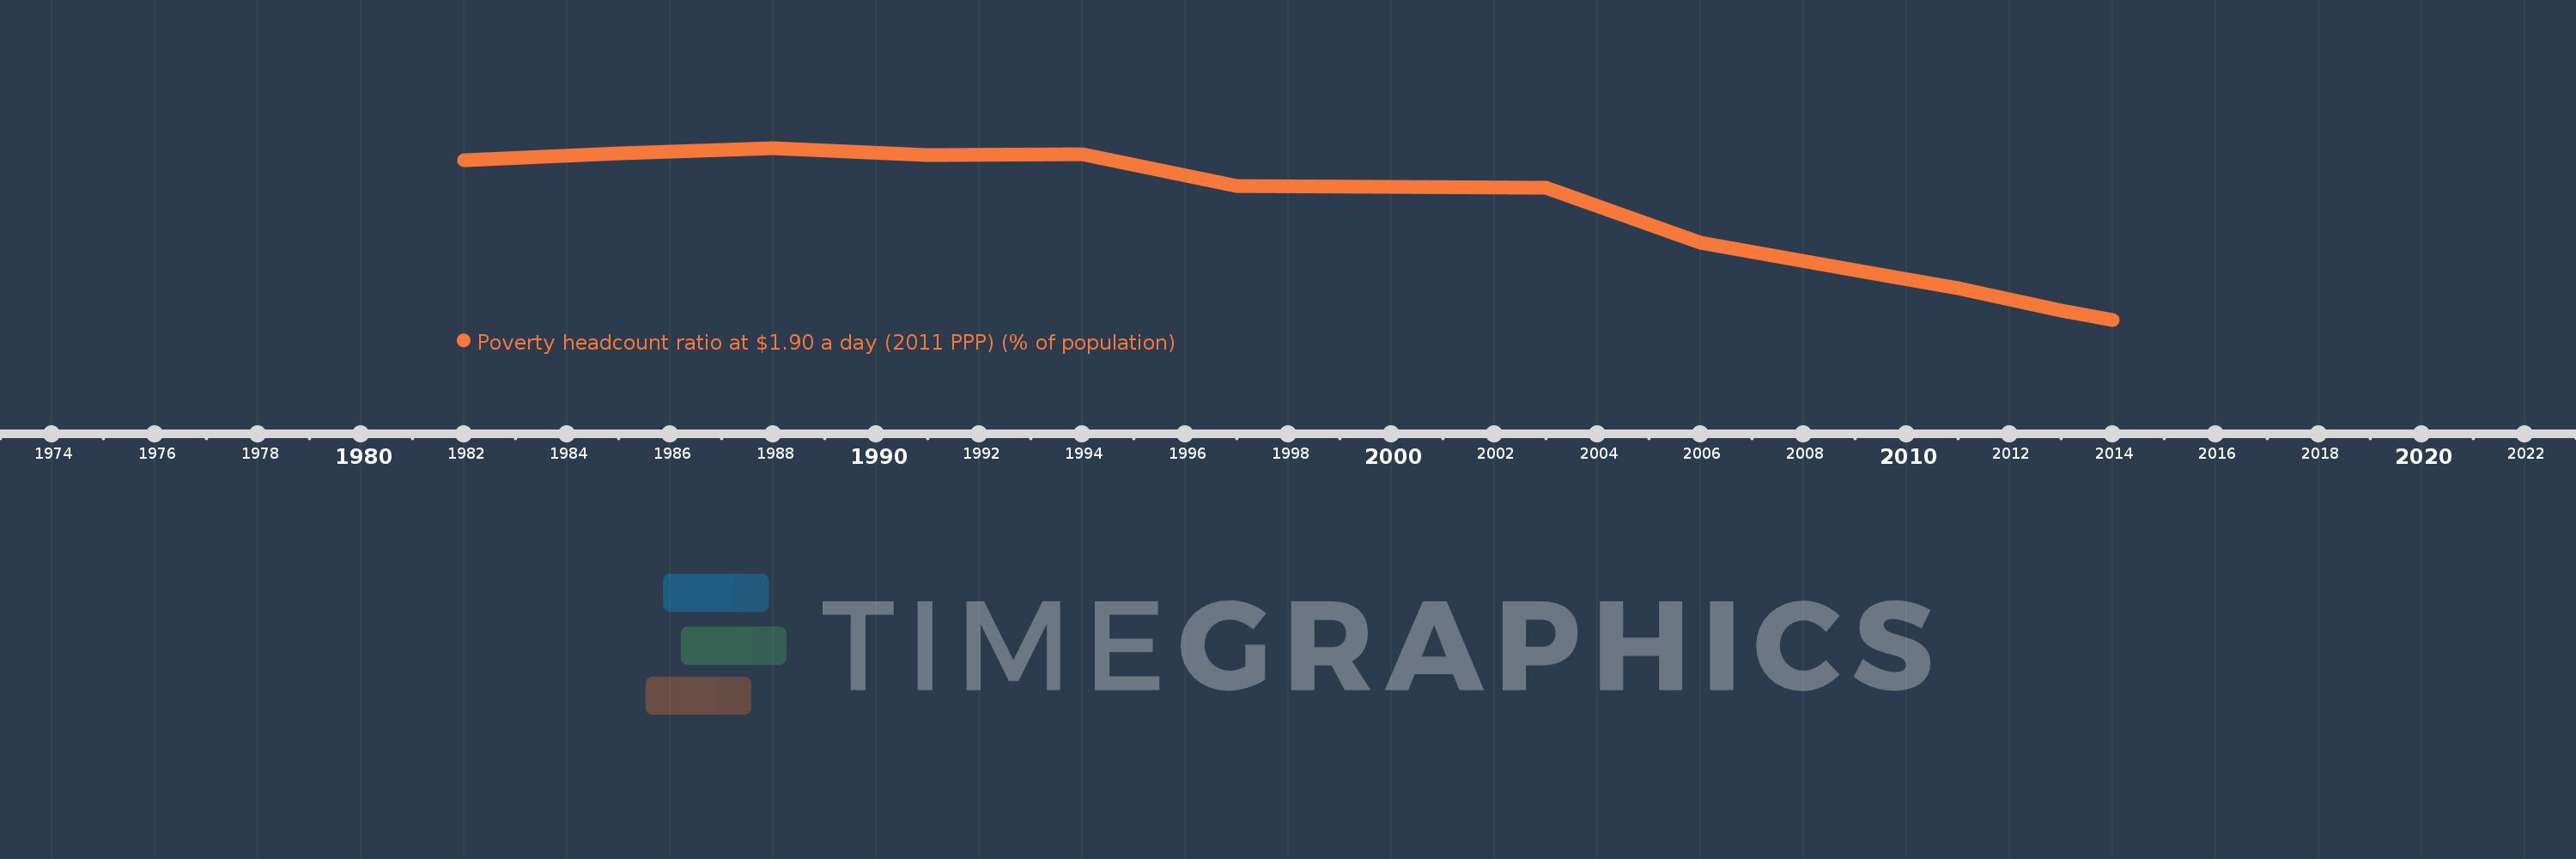
En esta escala de tiempo se presenta un gráfico de 1982 y 2014 de IDA total. Los datos de 1981 están ausentes. El número de observaciones reales por fecha: 14.
Fuente (nombre):
Indicadores del desarrollo mundial
Fuente (organización):
World Bank, Development Research Group. Data are based on primary household survey data obtained from government statistical agencies and World Bank country departments. Data for high-income economies are from the Luxembourg Income Study database. For more information and methodology, please see PovcalNet (http://iresearch.worldbank.org/PovcalNet/index.htm).
Categorías:
Poverty, Aid Effectiveness, Climate Change
Se ha actualizado:
23 abr 2017 año
Los indicadores de los cambios de valor en los últimos años
En promedio:
42.217
Mínimo:
28.95
1 ene 2014 año
Máximo:
51.51
1 ene 1988 año
A la fecha de observación
Valor
Cambio absoluto
El cambio con respecto al valor anterior
1 ene 1982 año
49.91
+49.91
0.0%
1 ene 1985 año
50.85
+0.94
1.88%
1 ene 1988 año
51.51
+0.66
1.3%
1 ene 1991 año
50.55
-0.96
-1.86%
1 ene 1994 año
50.64
+0.09
0.18%
1 ene 1997 año
46.54
-4.1
-8.1%
1 ene 2000 año
46.43
-0.11
-0.24%
1 ene 2003 año
46.27
-0.16
-0.34%
1 ene 2006 año
39.04
-7.23
-15.63%
1 ene 2009 año
35.47
-3.57
-9.14%
1 ene 2011 año
33.1
-2.37
-6.68%
1 ene 2012 año
31.58
-1.52
-4.59%
1 ene 2013 año
30.2
-1.38
-4.37%
1 ene 2014 año
28.95
-1.25
-4.14%
Ranking de los países por los datos estadísticos actuales