33
/es/
AIzaSyB4mHJ5NPEv-XzF7P6NDYXjlkCWaeKw5bc
November 1, 2025
90145
Botswana
BWA
true
2
1
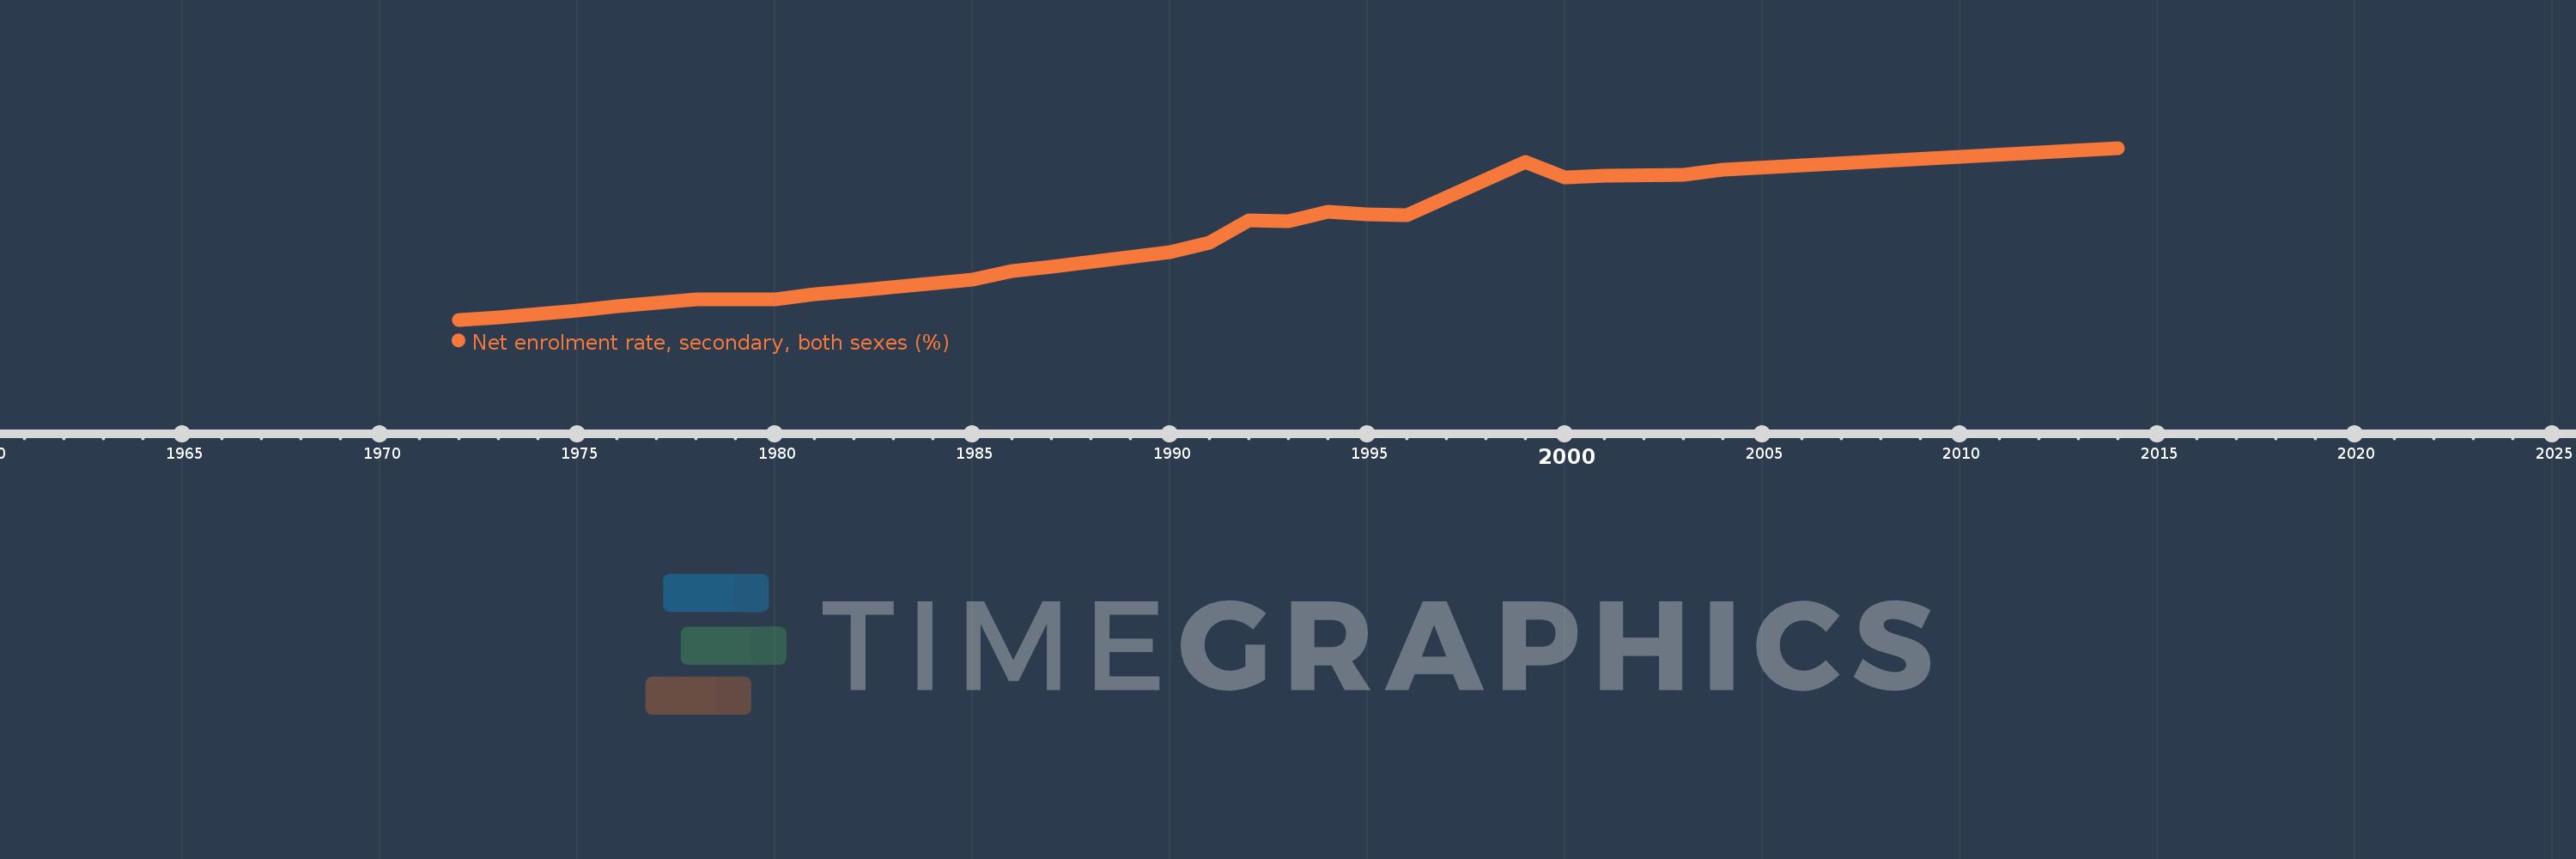
Net enrolment rate, secondary, both sexes (%)
2014,2004,2003,2001,2000,1999,1996,1995,1994,1993,1992,1991,1990,1987,1986,1985,1982,1981,1980,1979,1978,1977,1976,1975,1974,1973,1972