33
/es/
AIzaSyAYiBZKx7MnpbEhh9jyipgxe19OcubqV5w
August 1, 2025
112620
Costa Rica
CRI
true
2
1
Net enrolment rate, secondary, both sexes (%)
2015,2014,2013,2012,1997,1996,1995,1994,1993,1992,1991,1990,1988,1987,1986,1983,1982,1980,1977,1976,1975,1974,1971
Download
Estadísticas Globales de la Biblioteca →Costa Rica →

Net enrolment rate, secondary, both sexes (%)

Estas estadísticas en otros países:

AfghanistanAlbaniaAlgeriaAngolaAntigua and BarbudaArab WorldArgentinaArmeniaArubaAustraliaAustriaAzerbaijanBahamas, TheBahrainBangladeshBarbadosBelarusBelgiumBelizeBeninBermudaBhutanBoliviaBotswanaBrazilBritish Virgin IslandsBrunei DarussalamBulgariaBurkina FasoBurundiCabo VerdeCambodiaCameroonCanadaCaribbean small statesCentral African RepublicCentral Europe and the BalticsChadChileColombiaComorosCongo, Dem. Rep.Congo, Rep.Costa RicaCroatiaCubaCyprusDenmarkDjiboutiDominicaDominican RepublicEarly-demographic dividendEast Asia & PacificEast Asia & Pacific (excluding high income)East Asia & Pacific (IDA & IBRD countries)EcuadorEgypt, Arab Rep.El SalvadorEquatorial GuineaEritreaEstoniaEthiopiaEuro areaEurope & Central AsiaEurope & Central Asia (excluding high income)Europe & Central Asia (IDA & IBRD countries)European UnionFijiFinlandFragile and conflict affected situationsFranceGambia, TheGeorgiaGhanaGreeceGrenadaGuatemalaGuineaGuinea-BissauGuyanaHeavily indebted poor countries (HIPC)High incomeHondurasHong Kong SAR, ChinaHungaryIBRD onlyIcelandIDA & IBRD totalIDA blendIDA onlyIDA totalIndiaIndonesiaIran, Islamic Rep.IraqIrelandIsraelItalyJamaicaJapanJordanKazakhstanKenyaKiribatiKorea, Dem. People’s Rep.Korea, Rep.KuwaitKyrgyz RepublicLao PDRLate-demographic dividendLatin America & Caribbean Latin America & Caribbean (excluding high income)Latin America & the Caribbean (IDA & IBRD countries)LatviaLeast developed countries: UN classificationLebanonLesothoLibyaLiechtensteinLithuaniaLow & middle incomeLow incomeLower middle incomeLuxembourgMacao SAR, ChinaMacedonia, FYRMadagascarMalawiMalaysiaMaldivesMaliMaltaMarshall IslandsMauritaniaMauritiusMexicoMiddle East & North AfricaMiddle East & North Africa (excluding high income)Middle East & North Africa (IDA & IBRD countries)Middle incomeMoldovaMongoliaMoroccoMozambiqueMyanmarNamibiaNauruNepalNetherlandsNew ZealandNicaraguaNigerNorth AmericaNorwayOECD membersOmanOther small statesPacific island small statesPakistanPanamaParaguayPeruPhilippinesPolandPortugalPost-demographic dividendPre-demographic dividendPuerto RicoQatarRomaniaSamoaSao Tome and PrincipeSaudi ArabiaSenegalSerbiaSeychellesSierra LeoneSloveniaSmall statesSolomon IslandsSomaliaSouth AfricaSouth AsiaSouth Asia (IDA & IBRD)SpainSri LankaSt. Kitts and NevisSt. LuciaSt. Vincent and the GrenadinesSub-Saharan Africa Sub-Saharan Africa (excluding high income)Sub-Saharan Africa (IDA & IBRD countries)SurinameSwazilandSwedenSwitzerlandSyrian Arab RepublicTajikistanThailandTimor-LesteTogoTongaTrinidad and TobagoTunisiaTurkeyTuvaluUgandaUkraineUnited Arab EmiratesUnited KingdomUnited StatesUpper middle incomeUruguayVanuatuVenezuela, RBVietnamWest Bank and GazaWorldYemen, Rep.Zimbabwe

línea de tiempo (timeline):

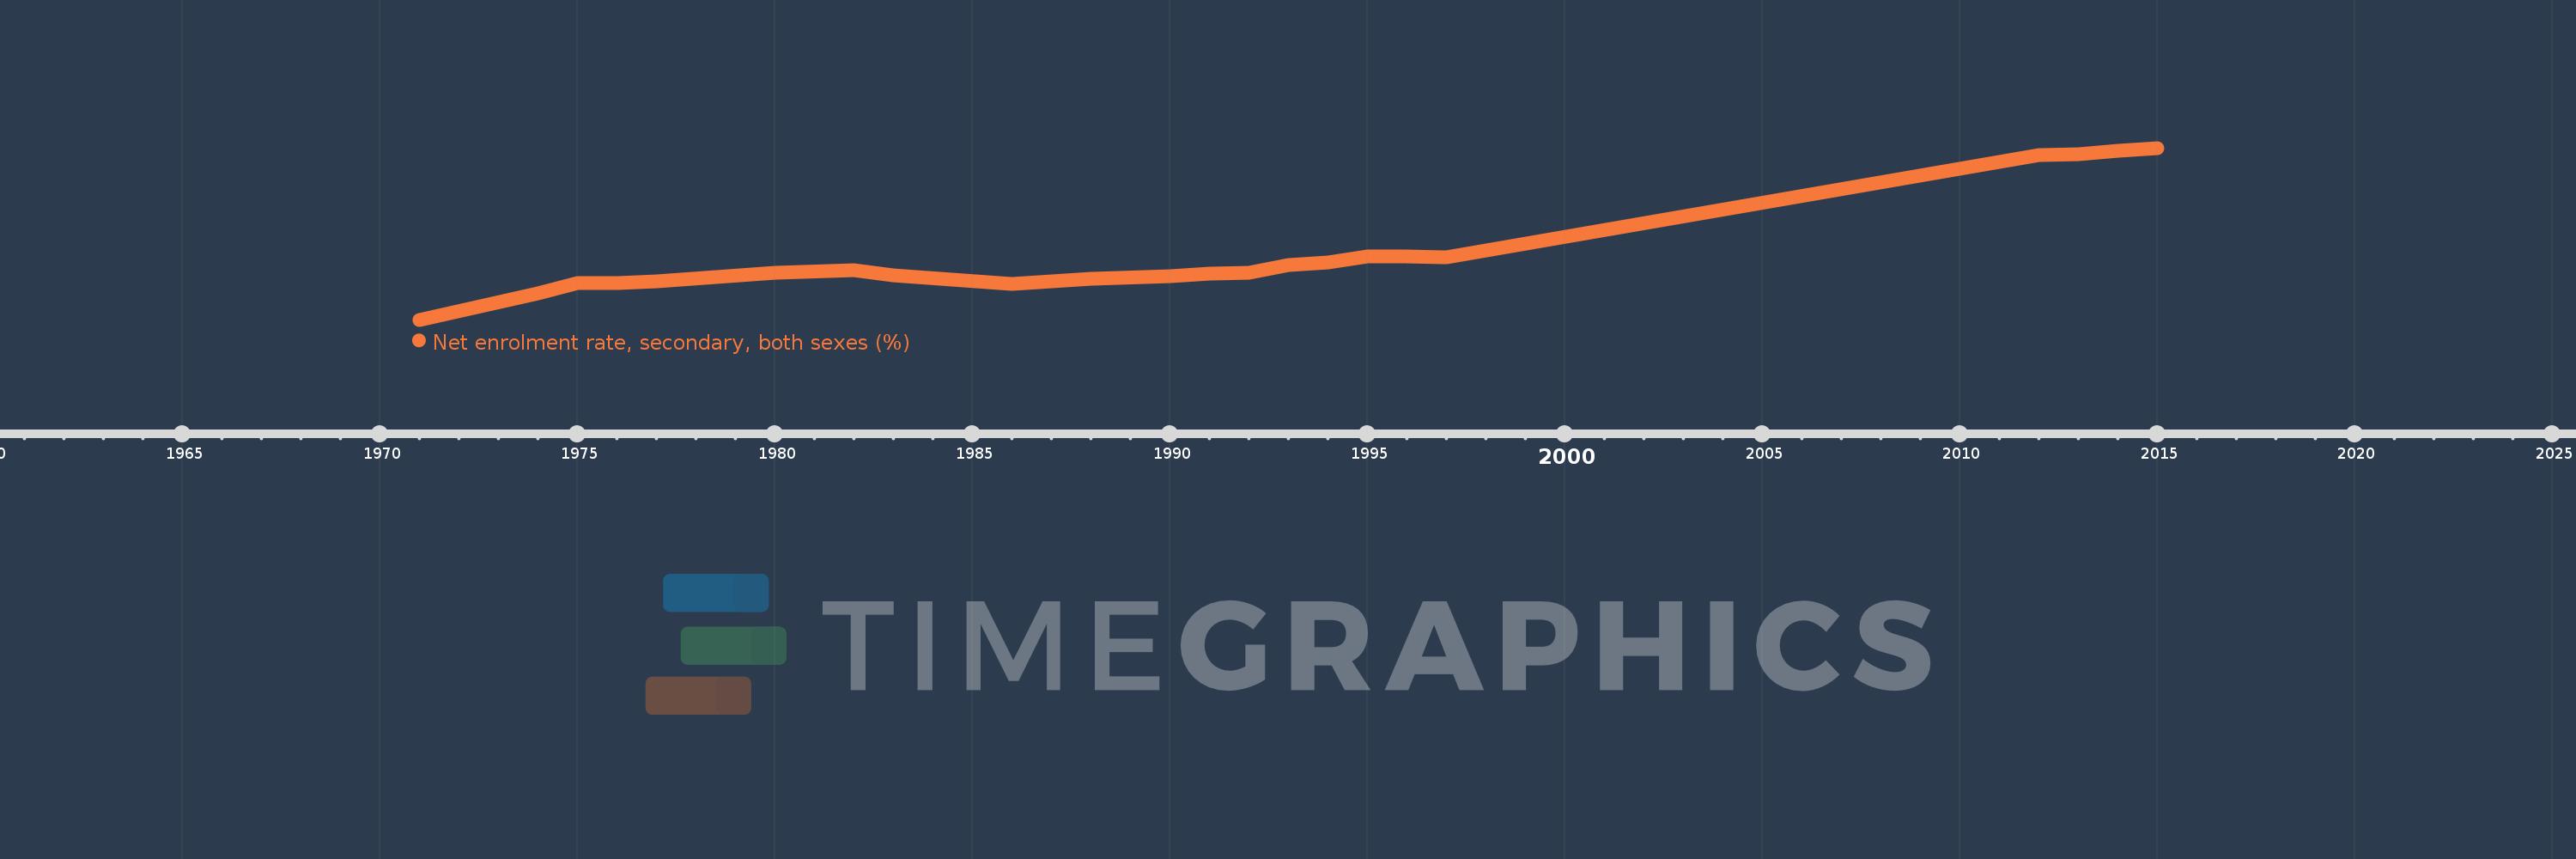
En esta escala de tiempo se presenta un gráfico de 1971 y 2015 de Costa Rica. Los datos de 1970 están ausentes. El número de observaciones reales por fecha: 23.

Fuente (nombre):

Indicadores del desarrollo mundial

Fuente (organización):

UNESCO Institute for Statistics

Categorías:

Education

Se ha actualizado:

23 abr 2017 año

Los indicadores de los cambios de valor en los últimos años

En promedio:
43.811
Mínimo:
22.726
1 ene 1971 año
Máximo:
78.121
1 ene 2015 año
A la fecha de observación
Valor
Cambio absoluto
El cambio con respecto al valor anterior
1 ene 1971 año
22.726
+22.726
0.0%
1 ene 1974 año
31.31
+8.584
37.77%
1 ene 1975 año
34.457
+3.146
10.05%
1 ene 1976 año
34.568
+0.111
0.32%
1 ene 1977 año
35.009
+0.441
1.27%
1 ene 1980 año
37.997
+2.989
8.54%
1 ene 1982 año
38.686
+0.688
1.81%
1 ene 1983 año
37.114
-1.572
-4.06%
1 ene 1986 año
34.357
-2.756
-7.43%
1 ene 1987 año
35.18
+0.823
2.39%
1 ene 1988 año
36.07
+0.89
2.53%
1 ene 1990 año
36.671
+0.6
1.66%
1 ene 1991 año
37.53
+0.859
2.34%
1 ene 1992 año
38.015
+0.485
1.29%
1 ene 1993 año
40.407
+2.391
6.29%
1 ene 1994 año
41.242
+0.835
2.07%
1 ene 1995 año
43.147
+1.905
4.62%
1 ene 1996 año
43.265
+0.118
0.27%
1 ene 1997 año
42.843
-0.422
-0.98%
1 ene 2012 año
75.855
+33.012
77.05%
1 ene 2013 año
75.967
+0.112
0.15%
1 ene 2014 año
77.122
+1.155
1.52%
1 ene 2015 año
78.121
+0.999
1.3%

Ranking de los países por los datos estadísticos actuales