33
/es/
AIzaSyB4mHJ5NPEv-XzF7P6NDYXjlkCWaeKw5bc
November 30, 2025
269706
Turkey
TUR
true
2
1
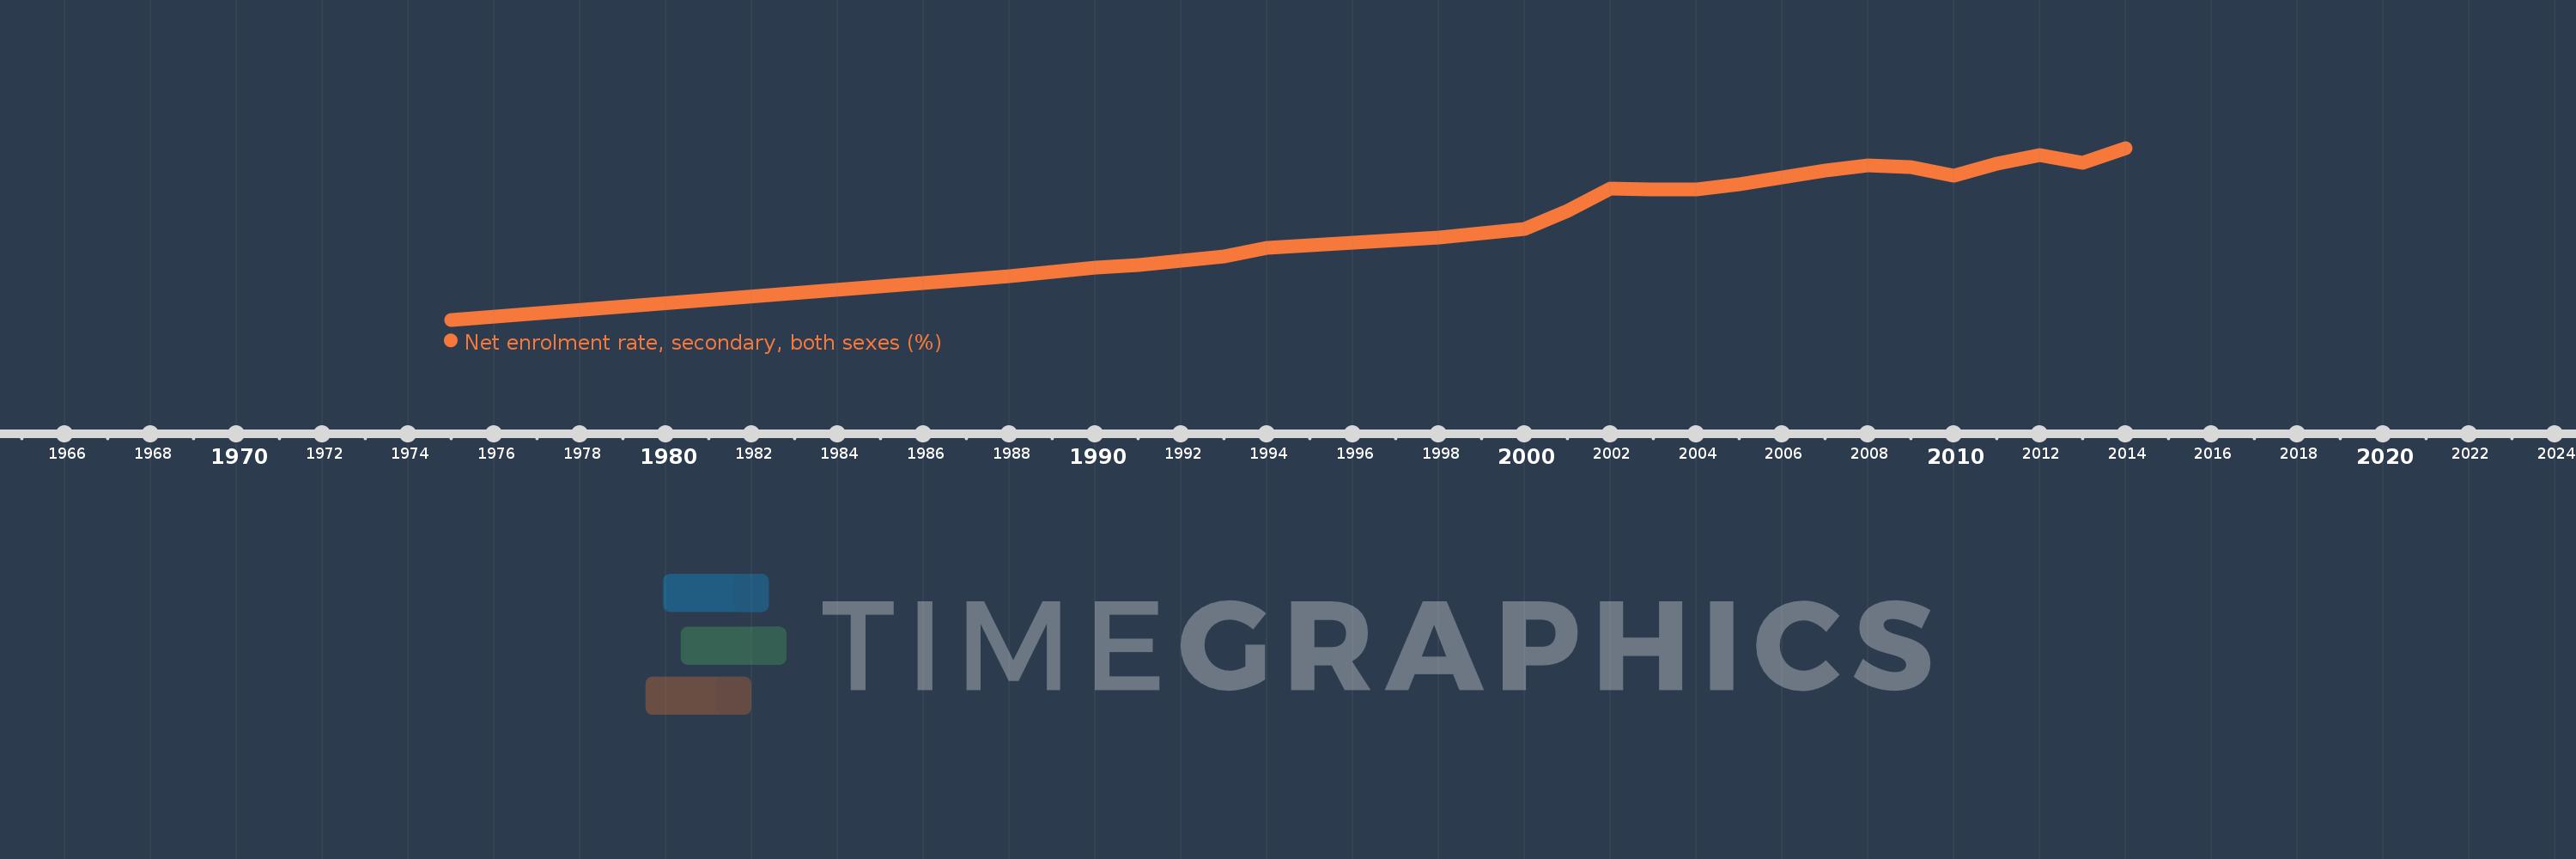
Net enrolment rate, secondary, both sexes (%)
2014,2013,2012,2011,2010,2009,2008,2007,2006,2005,2004,2003,2002,2001,2000,1998,1994,1993,1992,1991,1990,1989,1988,1987,1975