33
/es/
AIzaSyB4mHJ5NPEv-XzF7P6NDYXjlkCWaeKw5bc
November 30, 2025
85394
Bermuda
BMU
true
2
1
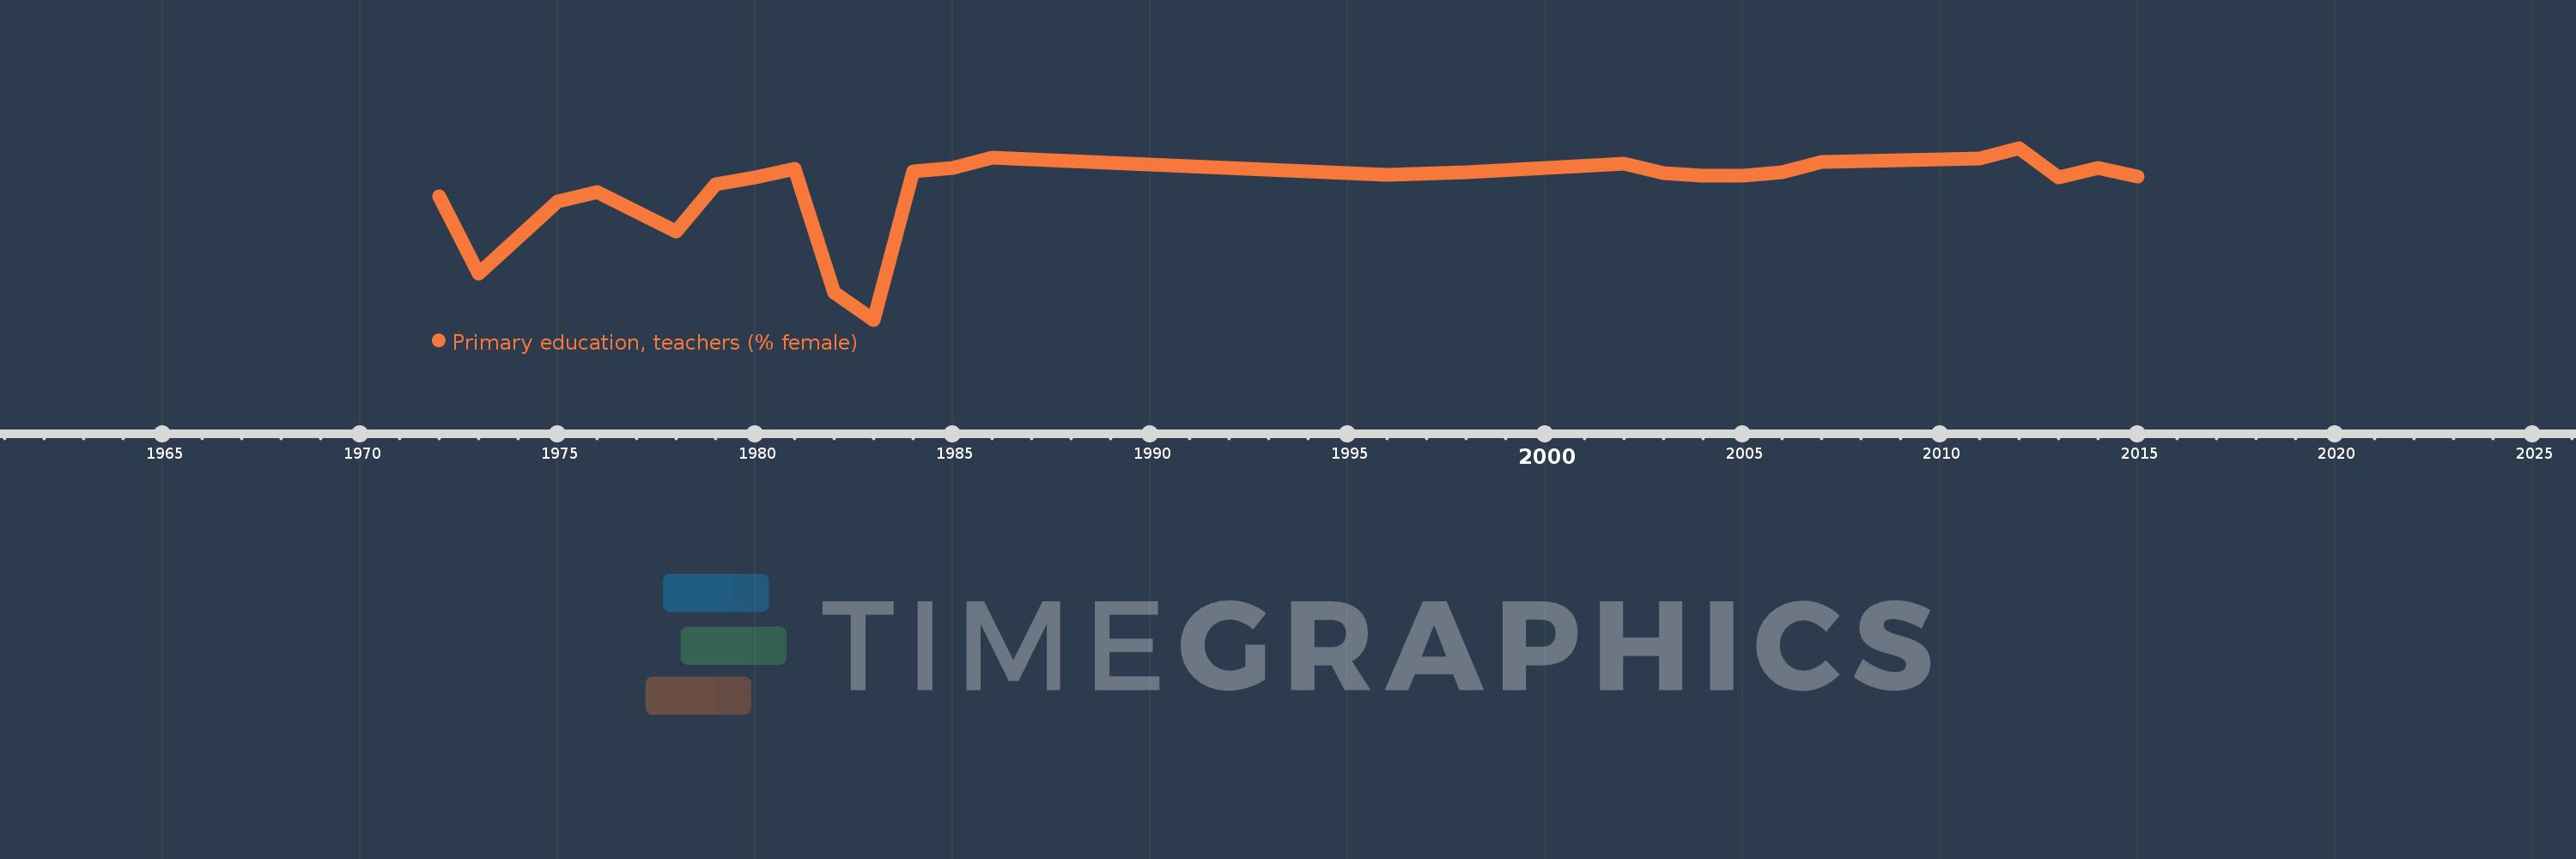
Primary education, teachers (% female)
2015,2014,2013,2012,2011,2007,2006,2005,2004,2003,2002,1998,1996,1986,1985,1984,1983,1982,1981,1980,1979,1978,1976,1975,1973,1972