33
/es/
AIzaSyAYiBZKx7MnpbEhh9jyipgxe19OcubqV5w
August 1, 2025
82234
Belgium
BEL
true
2
1
Services, etc., value added (constant LCU)
2016,2015,2014,2013,2012,2011,2010,2009,2008,2007,2006,2005,2004,2003,2002,2001,2000,1999,1998,1997,1996
Download
Estadísticas Globales de la Biblioteca →Belgium →

Services, etc., value added (constant LCU)

Estas estadísticas en otros países:

AfghanistanAlbaniaAlgeriaAntigua and BarbudaArgentinaArmeniaAustraliaAustriaAzerbaijanBahamas, TheBahrainBangladeshBelarusBelgiumBelizeBeninBermudaBhutanBoliviaBosnia and HerzegovinaBotswanaBrazilBrunei DarussalamBulgariaBurkina FasoBurundiCabo VerdeCambodiaCameroonCanadaCentral African RepublicChadChileChinaColombiaComorosCongo, Dem. Rep.Congo, Rep.Costa RicaCote d'IvoireCroatiaCubaCyprusCzech RepublicDenmarkDjiboutiDominicaDominican RepublicEcuadorEgypt, Arab Rep.El SalvadorEquatorial GuineaEritreaEstoniaEthiopiaFijiFinlandFranceGabonGambia, TheGeorgiaGermanyGhanaGreeceGrenadaGuatemalaGuineaGuinea-BissauGuyanaHaitiHondurasHong Kong SAR, ChinaHungaryIcelandIndiaIndonesiaIran, Islamic Rep.IraqIrelandItalyJamaicaJapanJordanKazakhstanKenyaKiribatiKorea, Rep.KosovoKuwaitKyrgyz RepublicLao PDRLatviaLebanonLesothoLiberiaLithuaniaLuxembourgMacedonia, FYRMadagascarMalawiMalaysiaMaldivesMaliMarshall IslandsMauritaniaMauritiusMexicoMicronesia, Fed. Sts.MoldovaMongoliaMontenegroMoroccoMozambiqueMyanmarNamibiaNepalNetherlandsNew ZealandNicaraguaNigerNigeriaNorwayOmanPakistanPalauPanamaPapua New GuineaParaguayPeruPhilippinesPolandPortugalPuerto RicoQatarRomaniaRussian FederationRwandaSamoaSao Tome and PrincipeSaudi ArabiaSenegalSerbiaSeychellesSierra LeoneSingaporeSlovak RepublicSloveniaSolomon IslandsSomaliaSouth AfricaSpainSri LankaSt. Kitts and NevisSt. LuciaSt. Vincent and the GrenadinesSudanSurinameSwazilandSwedenSwitzerlandSyrian Arab RepublicTajikistanTanzaniaThailandTimor-LesteTogoTongaTrinidad and TobagoTunisiaTurkeyTurkmenistanTuvaluUgandaUkraineUnited Arab EmiratesUnited KingdomUnited StatesUruguayUzbekistanVanuatuVenezuela, RBVietnamWest Bank and GazaZambiaZimbabwe

línea de tiempo (timeline):

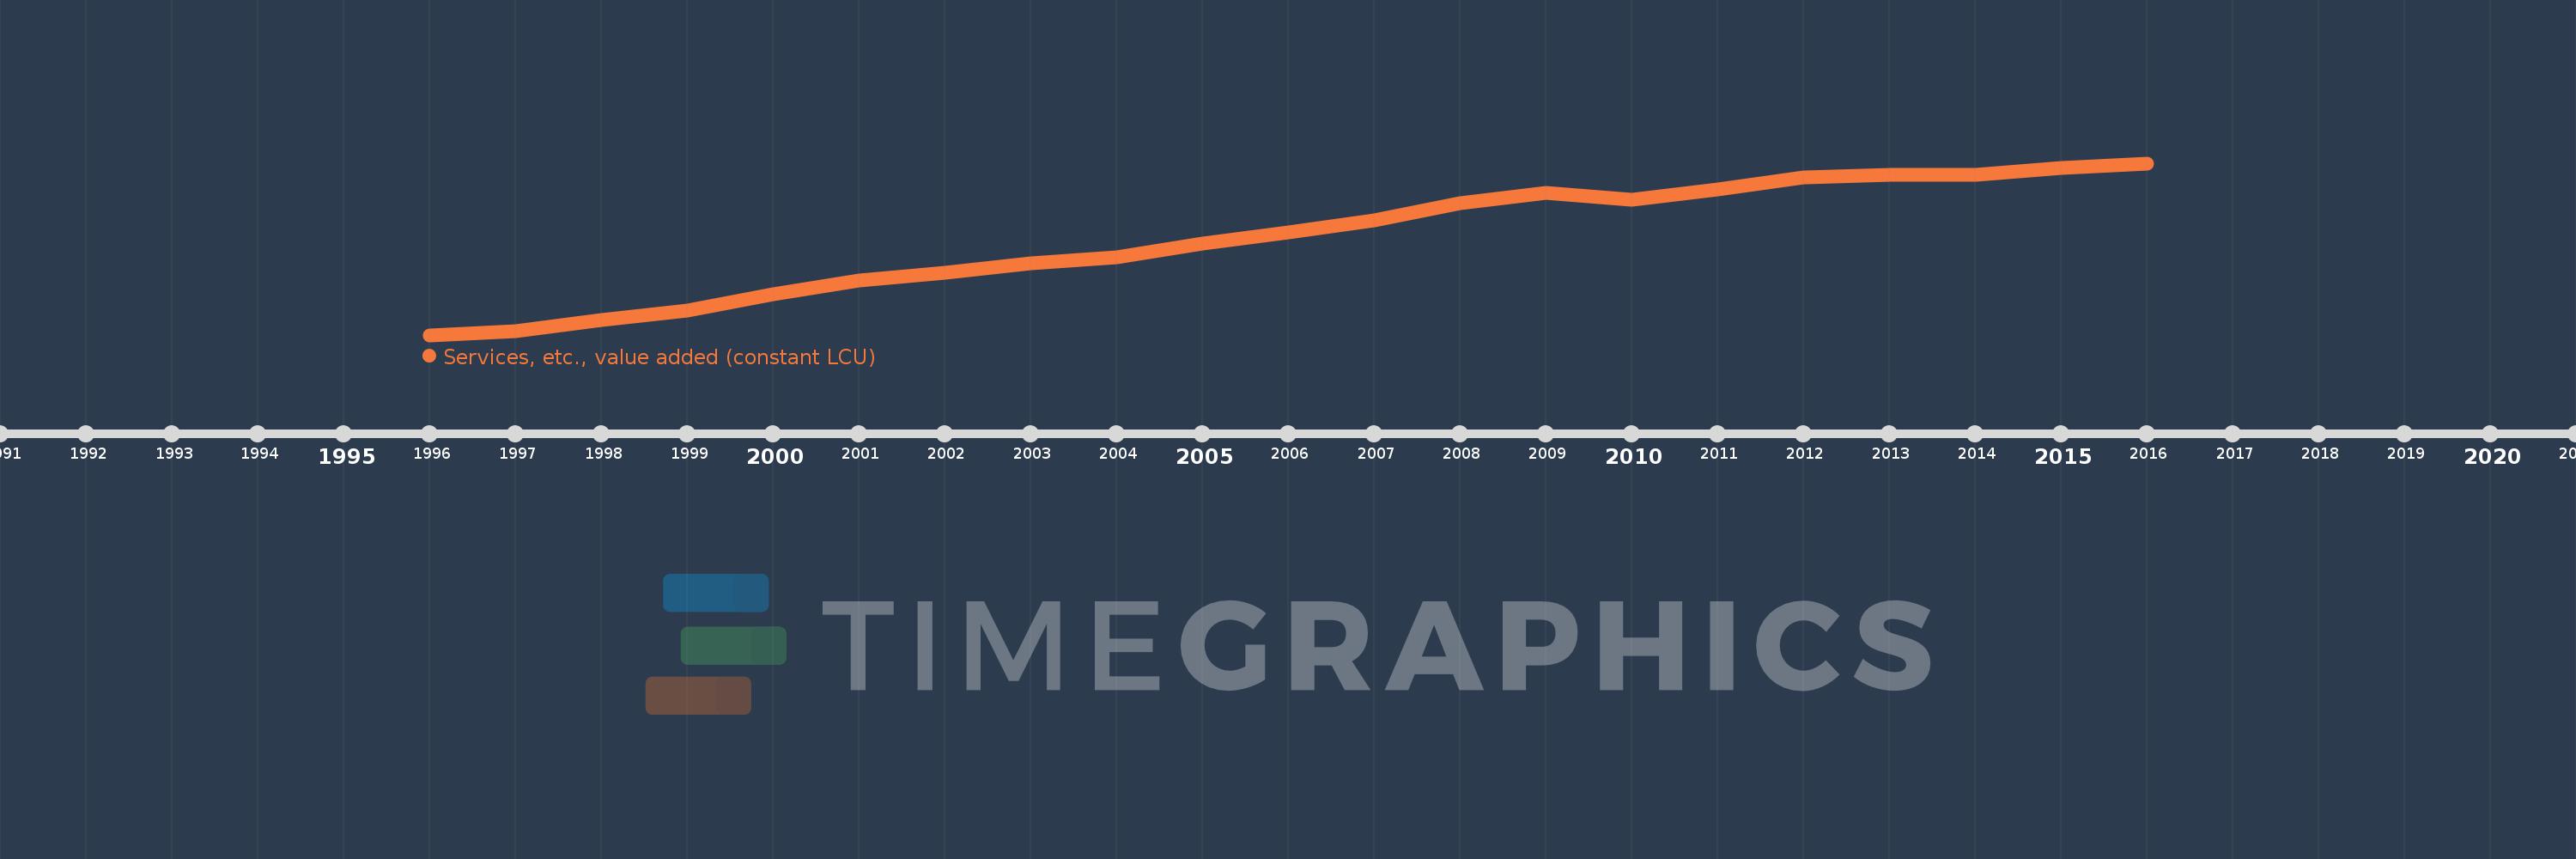
En esta escala de tiempo se presenta un gráfico de 1996 y 2016 de Belgium. Los datos de 1995 están ausentes. El número de observaciones reales por fecha: 21.

Fuente (nombre):

Indicadores del desarrollo mundial

Fuente (organización):

World Bank national accounts data, and OECD National Accounts data files.

Categorías:

Economy & Growth

Se ha actualizado:

23 abr 2017 año

Los indicadores de los cambios de valor en los últimos años

En promedio:
227.067 bn
Mínimo:
185.778 bn
1 ene 1996 año
Máximo:
259.109 bn
1 ene 2016 año
A la fecha de observación
Valor
Cambio absoluto
El cambio con respecto al valor anterior
1 ene 1996 año
185.778 bn
+185.778 bn
0.0%
1 ene 1997 año
187.499 bn
+1.721 bn
0.93%
1 ene 1998 año
192.312 bn
+4.813 bn
2.57%
1 ene 1999 año
196.122 bn
+3.81 bn
1.98%
1 ene 2000 año
203.316 bn
+7.194 bn
3.67%
1 ene 2001 año
209.009 bn
+5.693 bn
2.8%
1 ene 2002 año
212.185 bn
+3.177 bn
1.52%
1 ene 2003 año
216.371 bn
+4.186 bn
1.97%
1 ene 2004 año
218.999 bn
+2.628 bn
1.21%
1 ene 2005 año
224.647 bn
+5.647 bn
2.58%
1 ene 2006 año
229.755 bn
+5.109 bn
2.27%
1 ene 2007 año
234.698 bn
+4.942 bn
2.15%
1 ene 2008 año
241.941 bn
+7.243 bn
3.09%
1 ene 2009 año
246.445 bn
+4.504 bn
1.86%
1 ene 2010 año
243.622 bn
-2.823 bn
-1.15%
1 ene 2011 año
248.072 bn
+4.45 bn
1.83%
1 ene 2012 año
253.148 bn
+5.076 bn
2.05%
1 ene 2013 año
254.169 bn
+1.021 bn
0.4%
1 ene 2014 año
254.055 bn
-113.544 millones
-0.04%
1 ene 2015 año
257.15 bn
+3.095 bn
1.22%
1 ene 2016 año
259.109 bn
+1.959 bn
0.76%

Ranking de los países por los datos estadísticos actuales