30
/es/
AIzaSyAYiBZKx7MnpbEhh9jyipgxe19OcubqV5w
April 1, 2024
225392
Poland
POL
true
2
1
Services, etc., value added (constant LCU)
2016,2015,2014,2013,2012,2011,2010,2009,2008,2007,2006,2005,2004,2003,2002,2001,2000,1999,1998,1997
Download
Estadísticas Globales de la Biblioteca →Poland →

Services, etc., value added (constant LCU)

Estas estadísticas en otros países:

AfghanistanAlbaniaAlgeriaAntigua and BarbudaArgentinaArmeniaAustraliaAustriaAzerbaijanBahamas, TheBahrainBangladeshBelarusBelgiumBelizeBeninBermudaBhutanBoliviaBosnia and HerzegovinaBotswanaBrazilBrunei DarussalamBulgariaBurkina FasoBurundiCabo VerdeCambodiaCameroonCanadaCentral African RepublicChadChileChinaColombiaComorosCongo, Dem. Rep.Congo, Rep.Costa RicaCote d'IvoireCroatiaCubaCyprusCzech RepublicDenmarkDjiboutiDominicaDominican RepublicEcuadorEgypt, Arab Rep.El SalvadorEquatorial GuineaEritreaEstoniaEthiopiaFijiFinlandFranceGabonGambia, TheGeorgiaGermanyGhanaGreeceGrenadaGuatemalaGuineaGuinea-BissauGuyanaHaitiHondurasHong Kong SAR, ChinaHungaryIcelandIndiaIndonesiaIran, Islamic Rep.IraqIrelandItalyJamaicaJapanJordanKazakhstanKenyaKiribatiKorea, Rep.KosovoKuwaitKyrgyz RepublicLao PDRLatviaLebanonLesothoLiberiaLithuaniaLuxembourgMacedonia, FYRMadagascarMalawiMalaysiaMaldivesMaliMarshall IslandsMauritaniaMauritiusMexicoMicronesia, Fed. Sts.MoldovaMongoliaMontenegroMoroccoMozambiqueMyanmarNamibiaNepalNetherlandsNew ZealandNicaraguaNigerNigeriaNorwayOmanPakistanPalauPanamaPapua New GuineaParaguayPeruPhilippinesPolandPortugalPuerto RicoQatarRomaniaRussian FederationRwandaSamoaSao Tome and PrincipeSaudi ArabiaSenegalSerbiaSeychellesSierra LeoneSingaporeSlovak RepublicSloveniaSolomon IslandsSomaliaSouth AfricaSpainSri LankaSt. Kitts and NevisSt. LuciaSt. Vincent and the GrenadinesSudanSurinameSwazilandSwedenSwitzerlandSyrian Arab RepublicTajikistanTanzaniaThailandTimor-LesteTogoTongaTrinidad and TobagoTunisiaTurkeyTurkmenistanTuvaluUgandaUkraineUnited Arab EmiratesUnited KingdomUnited StatesUruguayUzbekistanVanuatuVenezuela, RBVietnamWest Bank and GazaZambiaZimbabwe

línea de tiempo (timeline):

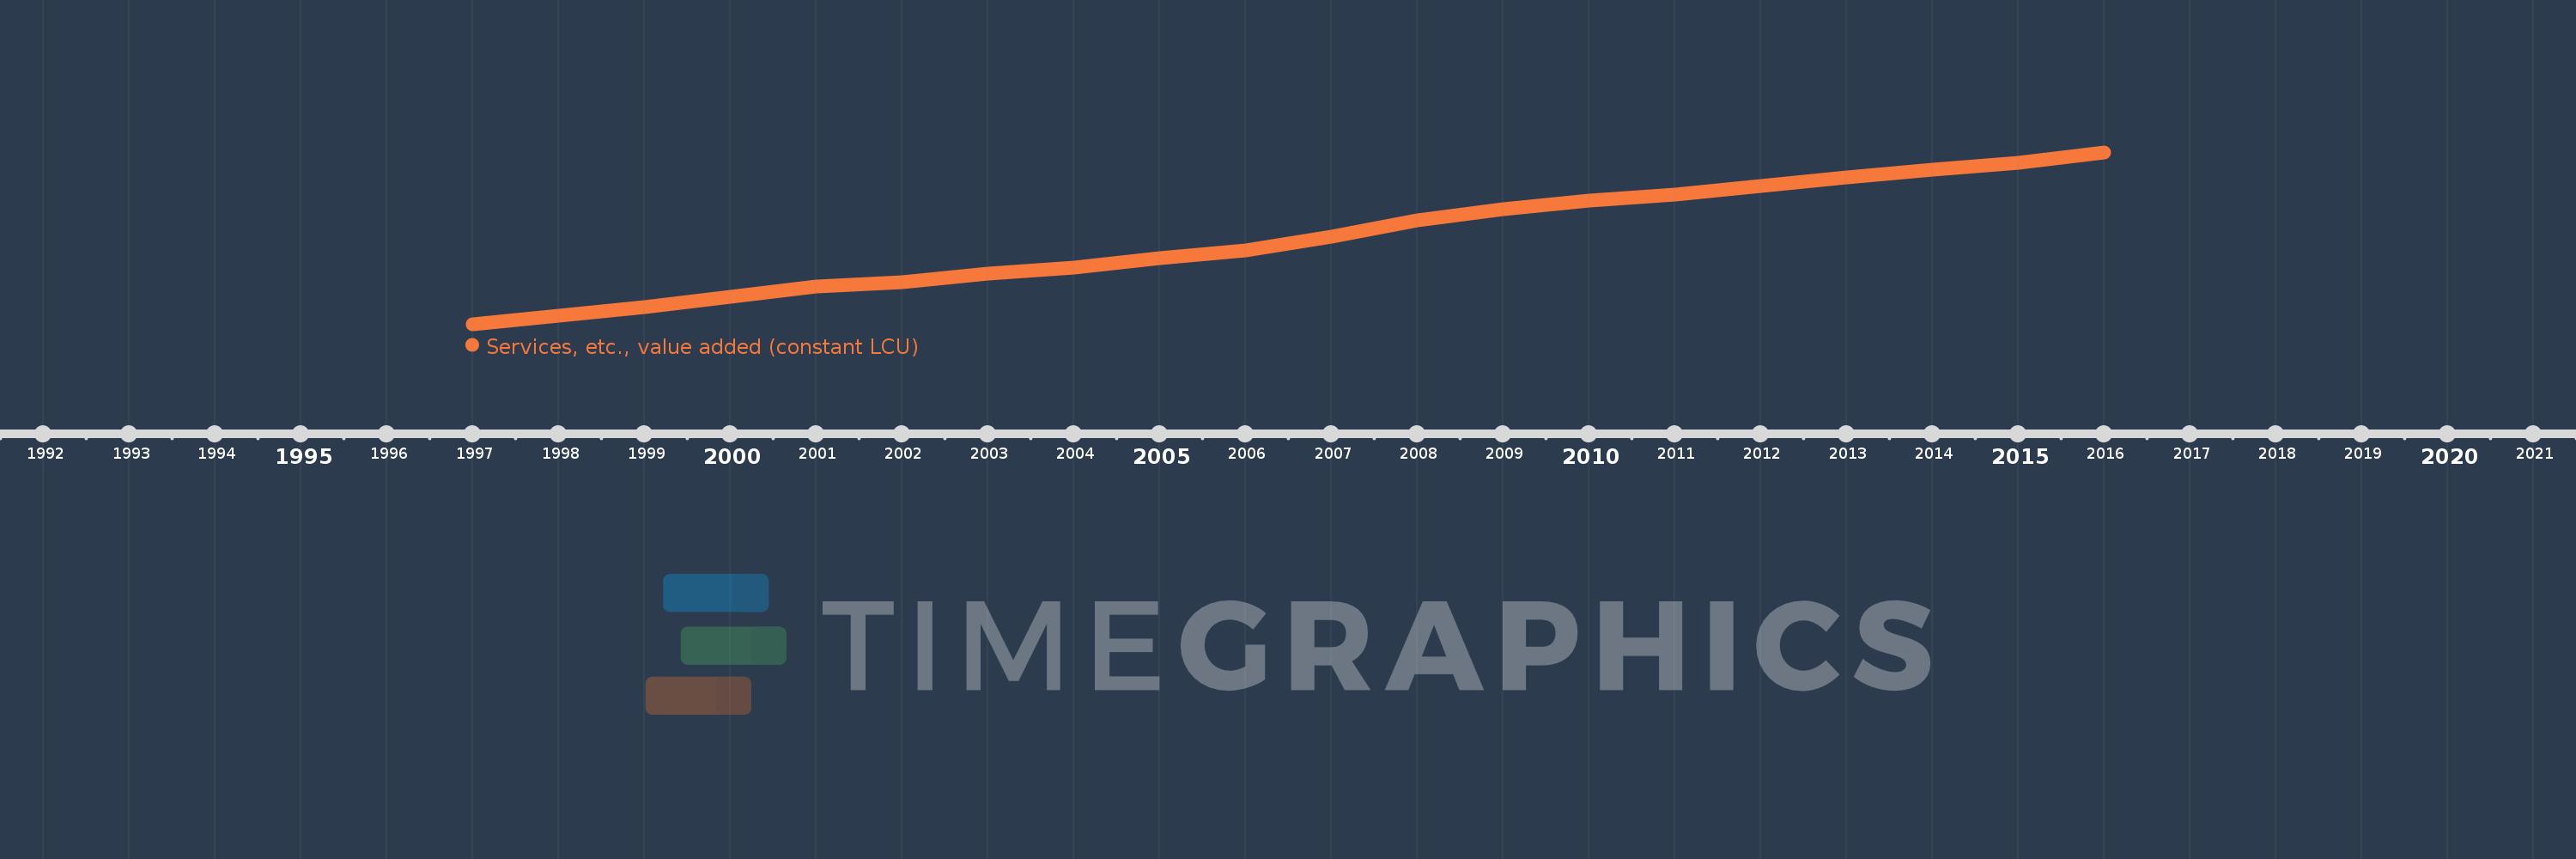
En esta escala de tiempo se presenta un gráfico de 1997 y 2016 de Poland. Los datos de 1996 están ausentes. El número de observaciones reales por fecha: 20.

Fuente (nombre):

Indicadores del desarrollo mundial

Fuente (organización):

World Bank national accounts data, and OECD National Accounts data files.

Categorías:

Economy & Growth

Se ha actualizado:

23 abr 2017 año

Los indicadores de los cambios de valor en los últimos años

En promedio:
696.042 bn
Mínimo:
469.647 bn
1 ene 1997 año
Máximo:
924.027 bn
1 ene 2016 año
A la fecha de observación
Valor
Cambio absoluto
El cambio con respecto al valor anterior
1 ene 1997 año
469.647 bn
+469.647 bn
0.0%
1 ene 1998 año
492.006 bn
+22.358 bn
4.76%
1 ene 1999 año
513.985 bn
+21.98 bn
4.47%
1 ene 2000 año
542.737 bn
+28.752 bn
5.59%
1 ene 2001 año
569.616 bn
+26.879 bn
4.95%
1 ene 2002 año
581.234 bn
+11.619 bn
2.04%
1 ene 2003 año
602.606 bn
+21.372 bn
3.68%
1 ene 2004 año
618.612 bn
+16.005 bn
2.66%
1 ene 2005 año
644.697 bn
+26.085 bn
4.22%
1 ene 2006 año
665.128 bn
+20.431 bn
3.17%
1 ene 2007 año
700.227 bn
+35.099 bn
5.28%
1 ene 2008 año
745.036 bn
+44.809 bn
6.4%
1 ene 2009 año
774.116 bn
+29.08 bn
3.9%
1 ene 2010 año
796.789 bn
+22.673 bn
2.93%
1 ene 2011 año
812.696 bn
+15.907 bn
2.0%
1 ene 2012 año
836.218 bn
+23.522 bn
2.89%
1 ene 2013 año
857.609 bn
+21.391 bn
2.56%
1 ene 2014 año
877.438 bn
+19.829 bn
2.31%
1 ene 2015 año
896.413 bn
+18.974 bn
2.16%
1 ene 2016 año
924.027 bn
+27.615 bn
3.08%

Ranking de los países por los datos estadísticos actuales