29
/es/
es
AIzaSyAYiBZKx7MnpbEhh9jyipgxe19OcubqV5w
April 1, 2024
115365
Croatia
HRV
true
2
1
Services, etc., value added (constant LCU)
2016,2015,2014,2013,2012,2011,2010,2009,2008,2007,2006,2005,2004,2003,2002,2001,2000,1999,1998,1997,1996
Download
Estadísticas Globales de la Biblioteca →Croatia →

Services, etc., value added (constant LCU)

Estas estadísticas en otros países:
AfghanistanAlbaniaAlgeriaAntigua and BarbudaArgentinaArmeniaAustraliaAustriaAzerbaijanBahamas, TheBahrainBangladeshBelarusBelgiumBelizeBeninBermudaBhutanBoliviaBosnia and HerzegovinaBotswanaBrazilBrunei DarussalamBulgariaBurkina FasoBurundiCabo VerdeCambodiaCameroonCanadaCentral African RepublicChadChileChinaColombiaComorosCongo, Dem. Rep.Congo, Rep.Costa RicaCote d'IvoireCroatiaCubaCyprusCzech RepublicDenmarkDjiboutiDominicaDominican RepublicEcuadorEgypt, Arab Rep.El SalvadorEquatorial GuineaEritreaEstoniaEthiopiaFijiFinlandFranceGabonGambia, TheGeorgiaGermanyGhanaGreeceGrenadaGuatemalaGuineaGuinea-BissauGuyanaHaitiHondurasHong Kong SAR, ChinaHungaryIcelandIndiaIndonesiaIran, Islamic Rep.IraqIrelandItalyJamaicaJapanJordanKazakhstanKenyaKiribatiKorea, Rep.KosovoKuwaitKyrgyz RepublicLao PDRLatviaLebanonLesothoLiberiaLithuaniaLuxembourgMacedonia, FYRMadagascarMalawiMalaysiaMaldivesMaliMarshall IslandsMauritaniaMauritiusMexicoMicronesia, Fed. Sts.MoldovaMongoliaMontenegroMoroccoMozambiqueMyanmarNamibiaNepalNetherlandsNew ZealandNicaraguaNigerNigeriaNorwayOmanPakistanPalauPanamaPapua New GuineaParaguayPeruPhilippinesPolandPortugalPuerto RicoQatarRomaniaRussian FederationRwandaSamoaSao Tome and PrincipeSaudi ArabiaSenegalSerbiaSeychellesSierra LeoneSingaporeSlovak RepublicSloveniaSolomon IslandsSomaliaSouth AfricaSpainSri LankaSt. Kitts and NevisSt. LuciaSt. Vincent and the GrenadinesSudanSurinameSwazilandSwedenSwitzerlandSyrian Arab RepublicTajikistanTanzaniaThailandTimor-LesteTogoTongaTrinidad and TobagoTunisiaTurkeyTurkmenistanTuvaluUgandaUkraineUnited Arab EmiratesUnited KingdomUnited StatesUruguayUzbekistanVanuatuVenezuela, RBVietnamWest Bank and GazaZambiaZimbabwe
línea de tiempo (timeline):
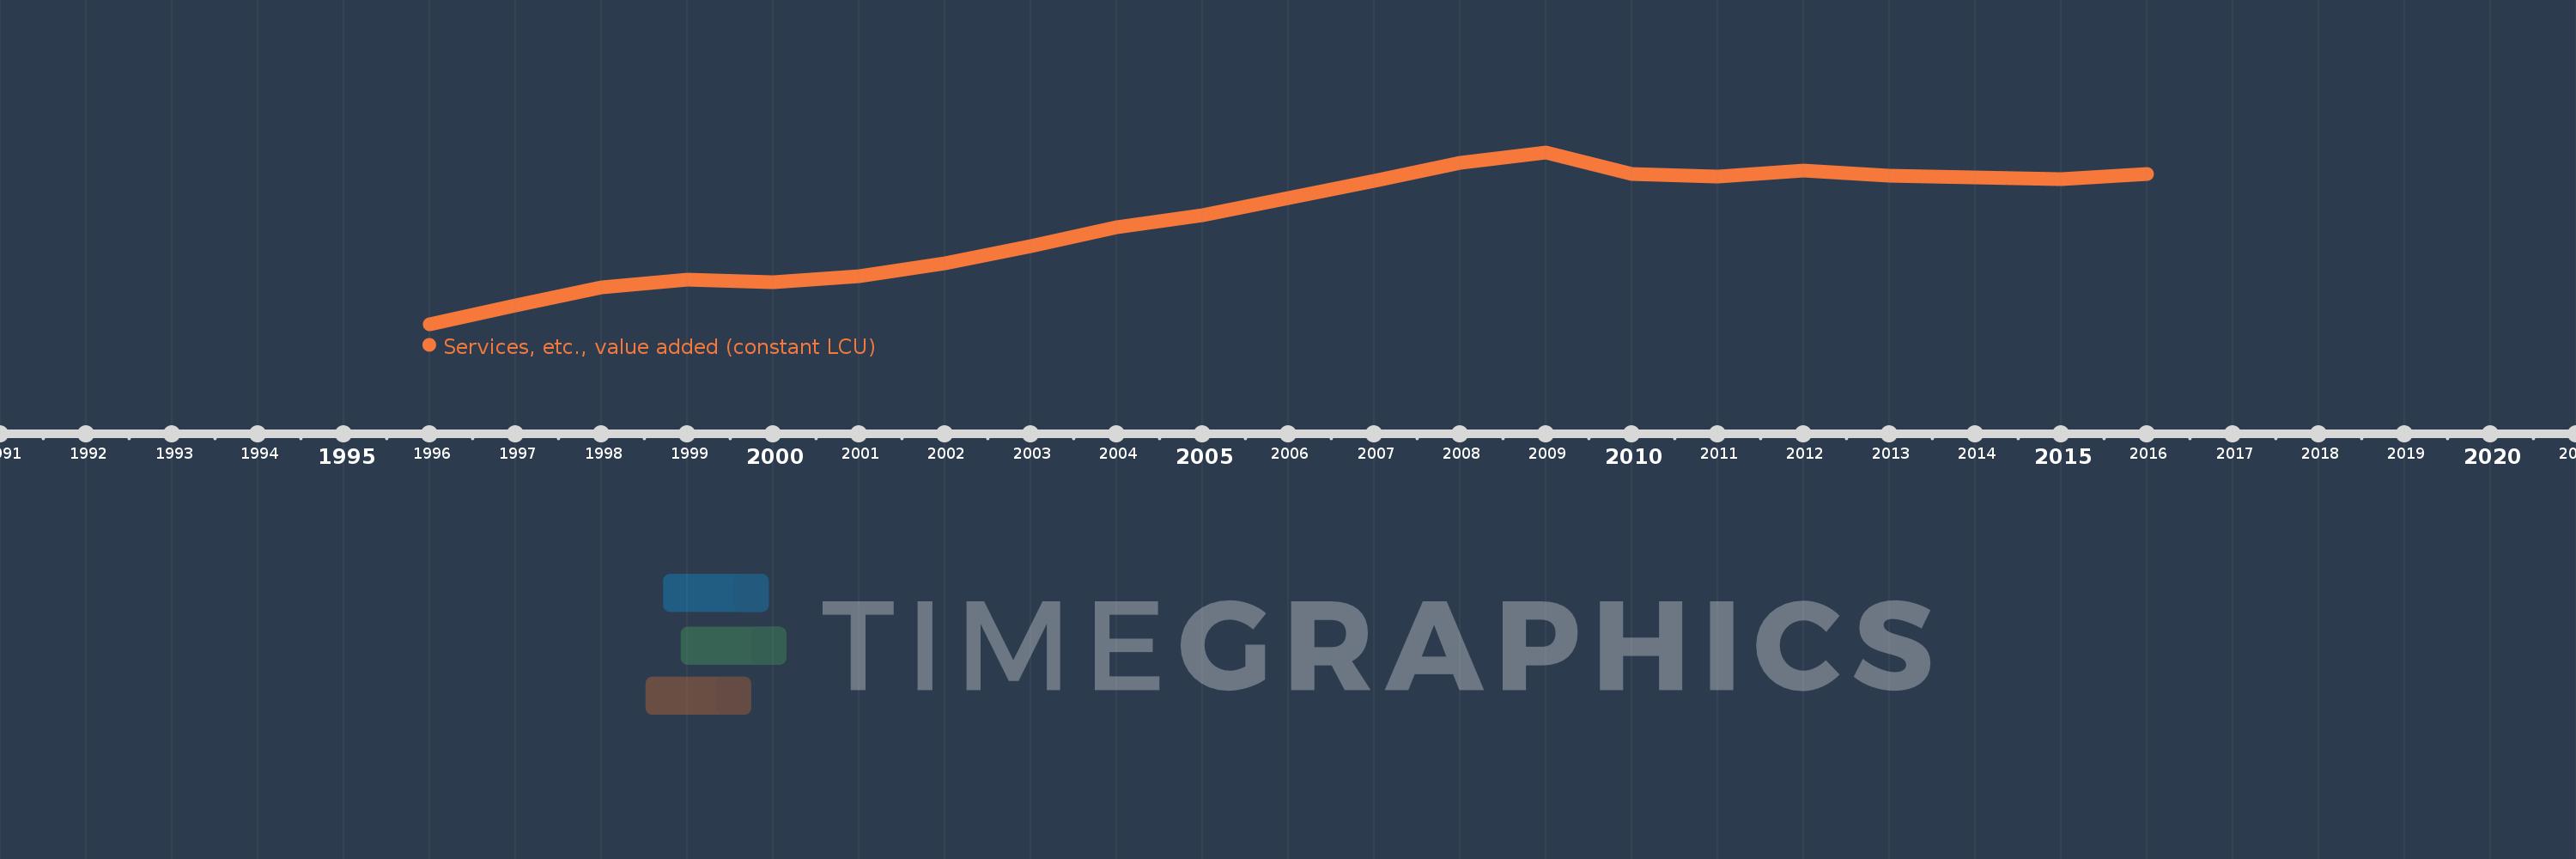
En esta escala de tiempo se presenta un gráfico de 1996 y 2016 de Croatia. Los datos de 1995 están ausentes. El número de observaciones reales por fecha: 21.
Fuente (nombre):
Indicadores del desarrollo mundial
Fuente (organización):
World Bank national accounts data, and OECD National Accounts data files.
Categorías:
Economy & Growth
Se ha actualizado:
23 abr 2017 año
Los indicadores de los cambios de valor en los últimos años
En promedio:
170.395 bn
Mínimo:
121.948 bn
1 ene 1996 año
Máximo:
202.153 bn
1 ene 2009 año
A la fecha de observación
Valor
Cambio absoluto
El cambio con respecto al valor anterior
1 ene 1996 año
121.948 bn
+121.948 bn
0.0%
1 ene 1997 año
130.662 bn
+8.714 bn
7.15%
1 ene 1998 año
139.08 bn
+8.418 bn
6.44%
1 ene 1999 año
142.689 bn
+3.608 bn
2.59%
1 ene 2000 año
141.428 bn
-1.261 bn
-0.88%
1 ene 2001 año
144.242 bn
+2.814 bn
1.99%
1 ene 2002 año
150.356 bn
+6.115 bn
4.24%
1 ene 2003 año
158.337 bn
+7.981 bn
5.31%
1 ene 2004 año
167.4 bn
+9.062 bn
5.72%
1 ene 2005 año
172.748 bn
+5.348 bn
3.19%
1 ene 2006 año
180.664 bn
+7.916 bn
4.58%
1 ene 2007 año
188.88 bn
+8.216 bn
4.55%
1 ene 2008 año
197.456 bn
+8.577 bn
4.54%
1 ene 2009 año
202.153 bn
+4.697 bn
2.38%
1 ene 2010 año
192.221 bn
-9.933 bn
-4.91%
1 ene 2011 año
190.911 bn
-1.31 bn
-0.68%
1 ene 2012 año
193.574 bn
+2.663 bn
1.4%
1 ene 2013 año
191.36 bn
-2.214 bn
-1.14%
1 ene 2014 año
190.326 bn
-1.034 bn
-0.54%
1 ene 2015 año
189.676 bn
-650.032 millones
-0.34%
1 ene 2016 año
192.186 bn
+2.51 bn
1.32%
Ranking de los países por los datos estadísticos actuales

Comentarios:

Enviar
PremiumAbout & FeedbackAcuerdoPrivacidad
logo
© 2022 Selected Technologies LLC – Morgan Hill, California