33
/es/
AIzaSyAYiBZKx7MnpbEhh9jyipgxe19OcubqV5w
August 1, 2025
82036
Belgium
BEL
true
2
1
Net acquisition of financial assets (% of GDP)
2013,2012,2011,2010,2009,2008,2007,2006,2005,2004,2003,2002,2001,2000,1999,1998,1997,1996,1995,1994,1993,1992,1991
Download
Estadísticas Globales de la Biblioteca →Belgium →

Net acquisition of financial assets (% of GDP)

Estas estadísticas en otros países:

AfghanistanAlbaniaAlgeriaAngolaAntigua and BarbudaArmeniaAustraliaAustriaAzerbaijanBahrainBangladeshBarbadosBelarusBelgiumBelizeBeninBhutanBoliviaBosnia and HerzegovinaBrazilBurkina FasoBurundiCabo VerdeCambodiaCanadaCaribbean small statesCentral African RepublicCentral Europe and the BalticsChileColombiaCongo, Dem. Rep.Congo, Rep.Cote d'IvoireCroatiaCyprusCzech RepublicDominicaDominican RepublicEgypt, Arab Rep.El SalvadorEquatorial GuineaEstoniaEthiopiaEuro areaEurope & Central Asia (excluding high income)Europe & Central Asia (IDA & IBRD countries)European UnionFijiFinlandFranceGeorgiaGermanyGhanaGuatemalaHigh incomeHondurasHong Kong SAR, ChinaHungaryIcelandIndiaIndonesiaIran, Islamic Rep.IraqIrelandIsraelItalyJamaicaJapanJordanKazakhstanKiribatiKorea, Rep.Kyrgyz RepublicLao PDRLebanonLesothoLithuaniaLow incomeLower middle incomeLuxembourgMacao SAR, ChinaMacedonia, FYRMadagascarMalawiMalaysiaMaldivesMaliMaltaMauritiusMicronesia, Fed. Sts.Middle East & North Africa (excluding high income)Middle East & North Africa (IDA & IBRD countries)MoldovaMongoliaMoroccoMozambiqueNamibiaNepalNetherlandsNew ZealandNigeriaNorth AmericaNorwayOECD membersOmanPacific island small statesParaguayPeruPhilippinesPolandPortugalPost-demographic dividendRomaniaRussian FederationRwandaSamoaSan MarinoSao Tome and PrincipeSenegalSerbiaSeychellesSingaporeSlovak RepublicSolomon IslandsSouth AfricaSouth AsiaSouth Asia (IDA & IBRD)SpainSri LankaSt. Kitts and NevisSub-Saharan Africa Sub-Saharan Africa (excluding high income)Sub-Saharan Africa (IDA & IBRD countries)SurinameSwazilandSwitzerlandSyrian Arab RepublicTanzaniaThailandTimor-LesteTogoTrinidad and TobagoTurkeyUgandaUkraineUnited Arab EmiratesUnited KingdomUnited StatesUruguayVanuatuVietnamWest Bank and GazaZimbabwe

línea de tiempo (timeline):

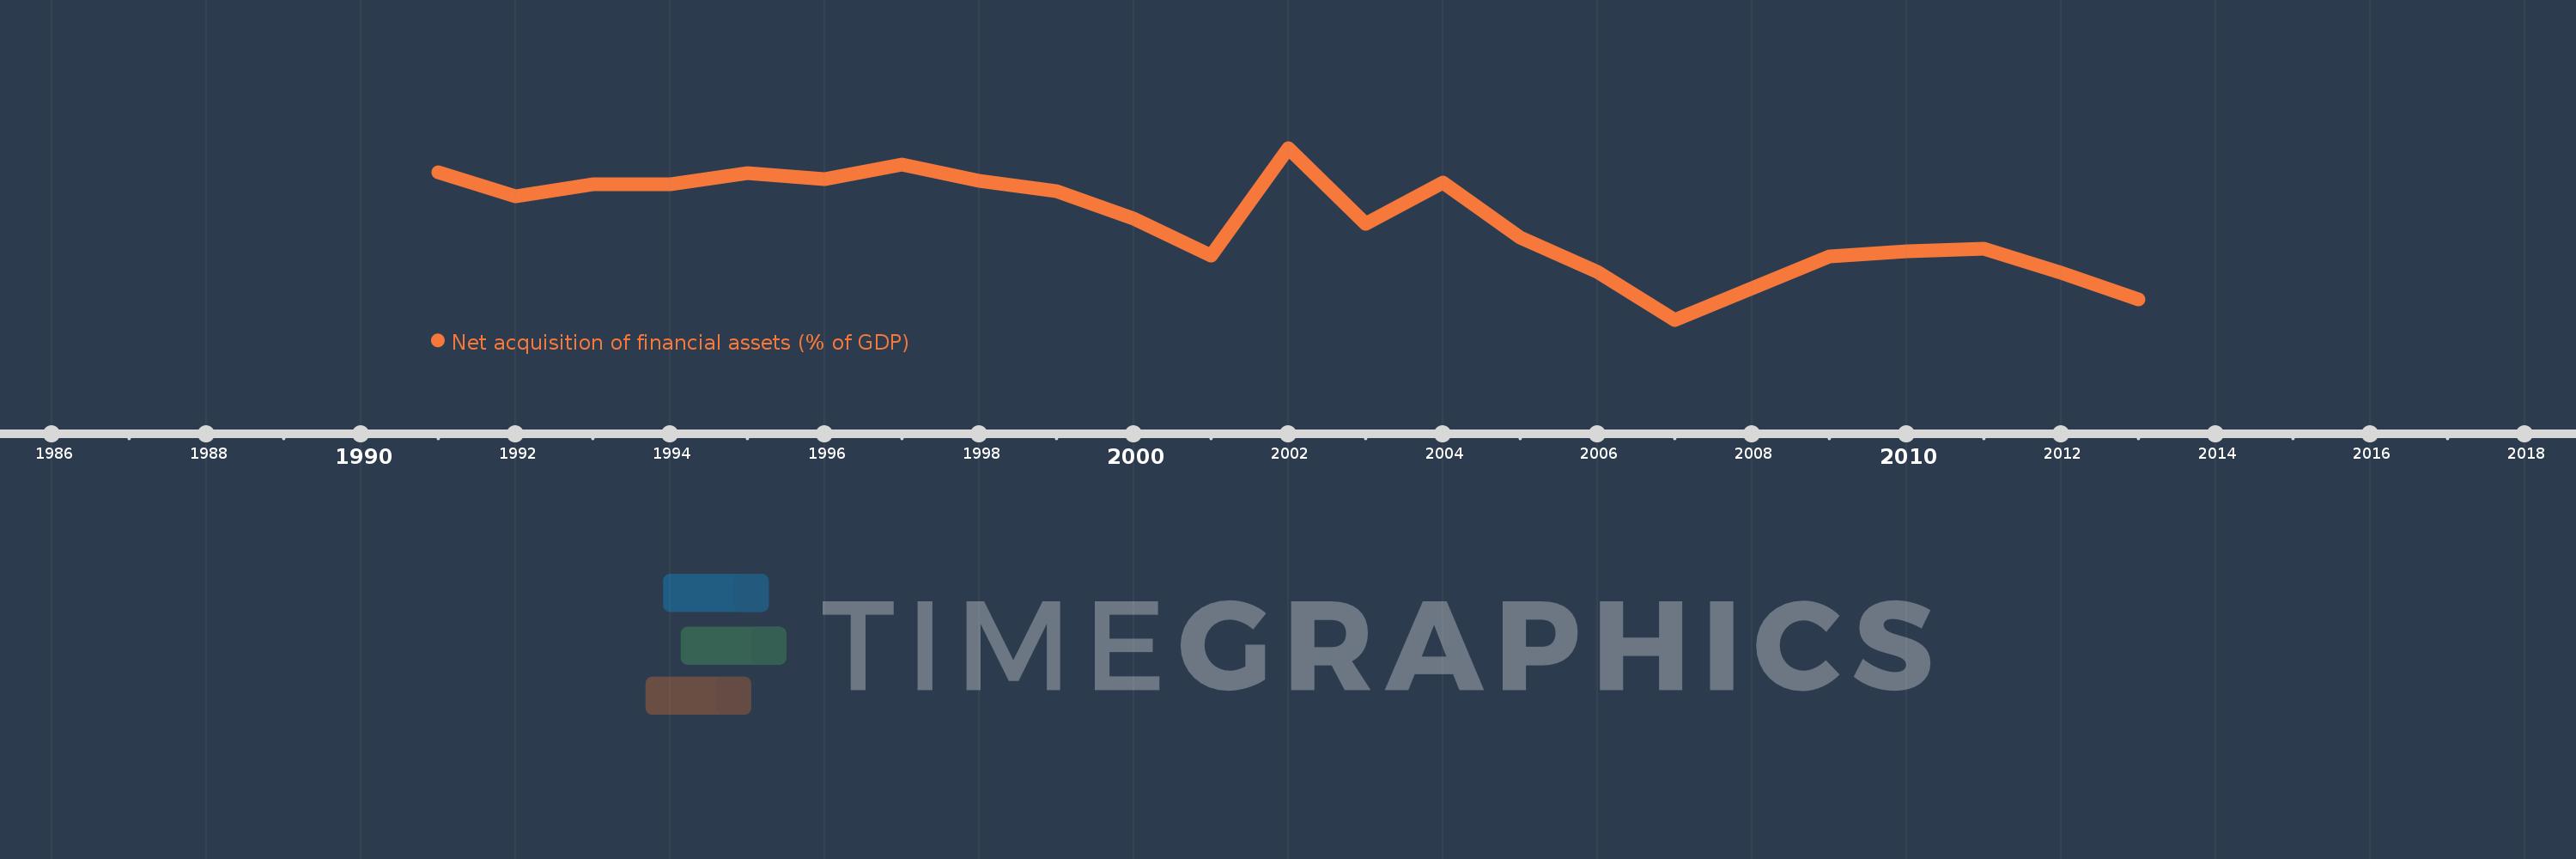
En esta escala de tiempo se presenta un gráfico de 1991 y 2013 de Belgium. Los datos de 1990 están ausentes. El número de observaciones reales por fecha: 23.

Fuente (nombre):

Indicadores del desarrollo mundial

Fuente (organización):

International Monetary Fund, Government Finance Statistics Yearbook and data files.

Categorías:

Public Sector

Se ha actualizado:

23 abr 2017 año

Los indicadores de los cambios de valor en los últimos años

En promedio:
-0.08
Mínimo:
-0.515
1 ene 2007 año
Máximo:
0.248
1 ene 2002 año
A la fecha de observación
Valor
Cambio absoluto
El cambio con respecto al valor anterior
1 ene 1991 año
0.14
+0.14
0.0%
1 ene 1992 año
0.033
-0.107
-76.26%
1 ene 1993 año
0.086
+0.053
160.09%
1 ene 1994 año
0.087
+0.001
0.62%
1 ene 1995 año
0.136
+0.049
56.59%
1 ene 1996 año
0.108
-0.028
-20.28%
1 ene 1997 año
0.173
+0.064
59.24%
1 ene 1998 año
0.103
-0.069
-40.19%
1 ene 1999 año
0.055
-0.048
-46.76%
1 ene 2000 año
-0.067
-0.122
-221.17%
1 ene 2001 año
-0.231
-0.165
247.18%
1 ene 2002 año
0.248
+0.479
-206.99%
1 ene 2003 año
-0.088
-0.336
-135.66%
1 ene 2004 año
0.094
+0.182
-206.46%
1 ene 2005 año
-0.148
-0.242
-257.76%
1 ene 2006 año
-0.301
-0.153
103.3%
1 ene 2007 año
-0.515
-0.214
70.96%
1 ene 2008 año
-0.376
+0.14
-27.13%
1 ene 2009 año
-0.235
+0.14
-37.38%
1 ene 2010 año
-0.212
+0.023
-9.88%
1 ene 2011 año
-0.199
+0.013
-6.33%
1 ene 2012 año
-0.308
-0.109
55.03%
1 ene 2013 año
-0.425
-0.117
38.14%

Ranking de los países por los datos estadísticos actuales