29
/es/
es
AIzaSyAYiBZKx7MnpbEhh9jyipgxe19OcubqV5w
April 1, 2024
152827
Hungary
HUN
true
2
1
Net acquisition of financial assets (% of GDP)
2014,2013,2012,2011,2010,2009,2008,2007,2006,2005,2004,2003,2002,2001,1995,1994,1993,1992
Download
Estadísticas Globales de la Biblioteca →Hungary →

Net acquisition of financial assets (% of GDP)

Estas estadísticas en otros países:
AfghanistanAlbaniaAlgeriaAngolaAntigua and BarbudaArmeniaAustraliaAustriaAzerbaijanBahrainBangladeshBarbadosBelarusBelgiumBelizeBeninBhutanBoliviaBosnia and HerzegovinaBrazilBurkina FasoBurundiCabo VerdeCambodiaCanadaCaribbean small statesCentral African RepublicCentral Europe and the BalticsChileColombiaCongo, Dem. Rep.Congo, Rep.Cote d'IvoireCroatiaCyprusCzech RepublicDominicaDominican RepublicEgypt, Arab Rep.El SalvadorEquatorial GuineaEstoniaEthiopiaEuro areaEurope & Central Asia (excluding high income)Europe & Central Asia (IDA & IBRD countries)European UnionFijiFinlandFranceGeorgiaGermanyGhanaGuatemalaHigh incomeHondurasHong Kong SAR, ChinaHungaryIcelandIndiaIndonesiaIran, Islamic Rep.IraqIrelandIsraelItalyJamaicaJapanJordanKazakhstanKiribatiKorea, Rep.Kyrgyz RepublicLao PDRLebanonLesothoLithuaniaLow incomeLower middle incomeLuxembourgMacao SAR, ChinaMacedonia, FYRMadagascarMalawiMalaysiaMaldivesMaliMaltaMauritiusMicronesia, Fed. Sts.Middle East & North Africa (excluding high income)Middle East & North Africa (IDA & IBRD countries)MoldovaMongoliaMoroccoMozambiqueNamibiaNepalNetherlandsNew ZealandNigeriaNorth AmericaNorwayOECD membersOmanPacific island small statesParaguayPeruPhilippinesPolandPortugalPost-demographic dividendRomaniaRussian FederationRwandaSamoaSan MarinoSao Tome and PrincipeSenegalSerbiaSeychellesSingaporeSlovak RepublicSolomon IslandsSouth AfricaSouth AsiaSouth Asia (IDA & IBRD)SpainSri LankaSt. Kitts and NevisSub-Saharan Africa Sub-Saharan Africa (excluding high income)Sub-Saharan Africa (IDA & IBRD countries)SurinameSwazilandSwitzerlandSyrian Arab RepublicTanzaniaThailandTimor-LesteTogoTrinidad and TobagoTurkeyUgandaUkraineUnited Arab EmiratesUnited KingdomUnited StatesUruguayVanuatuVietnamWest Bank and GazaZimbabwe
línea de tiempo (timeline):
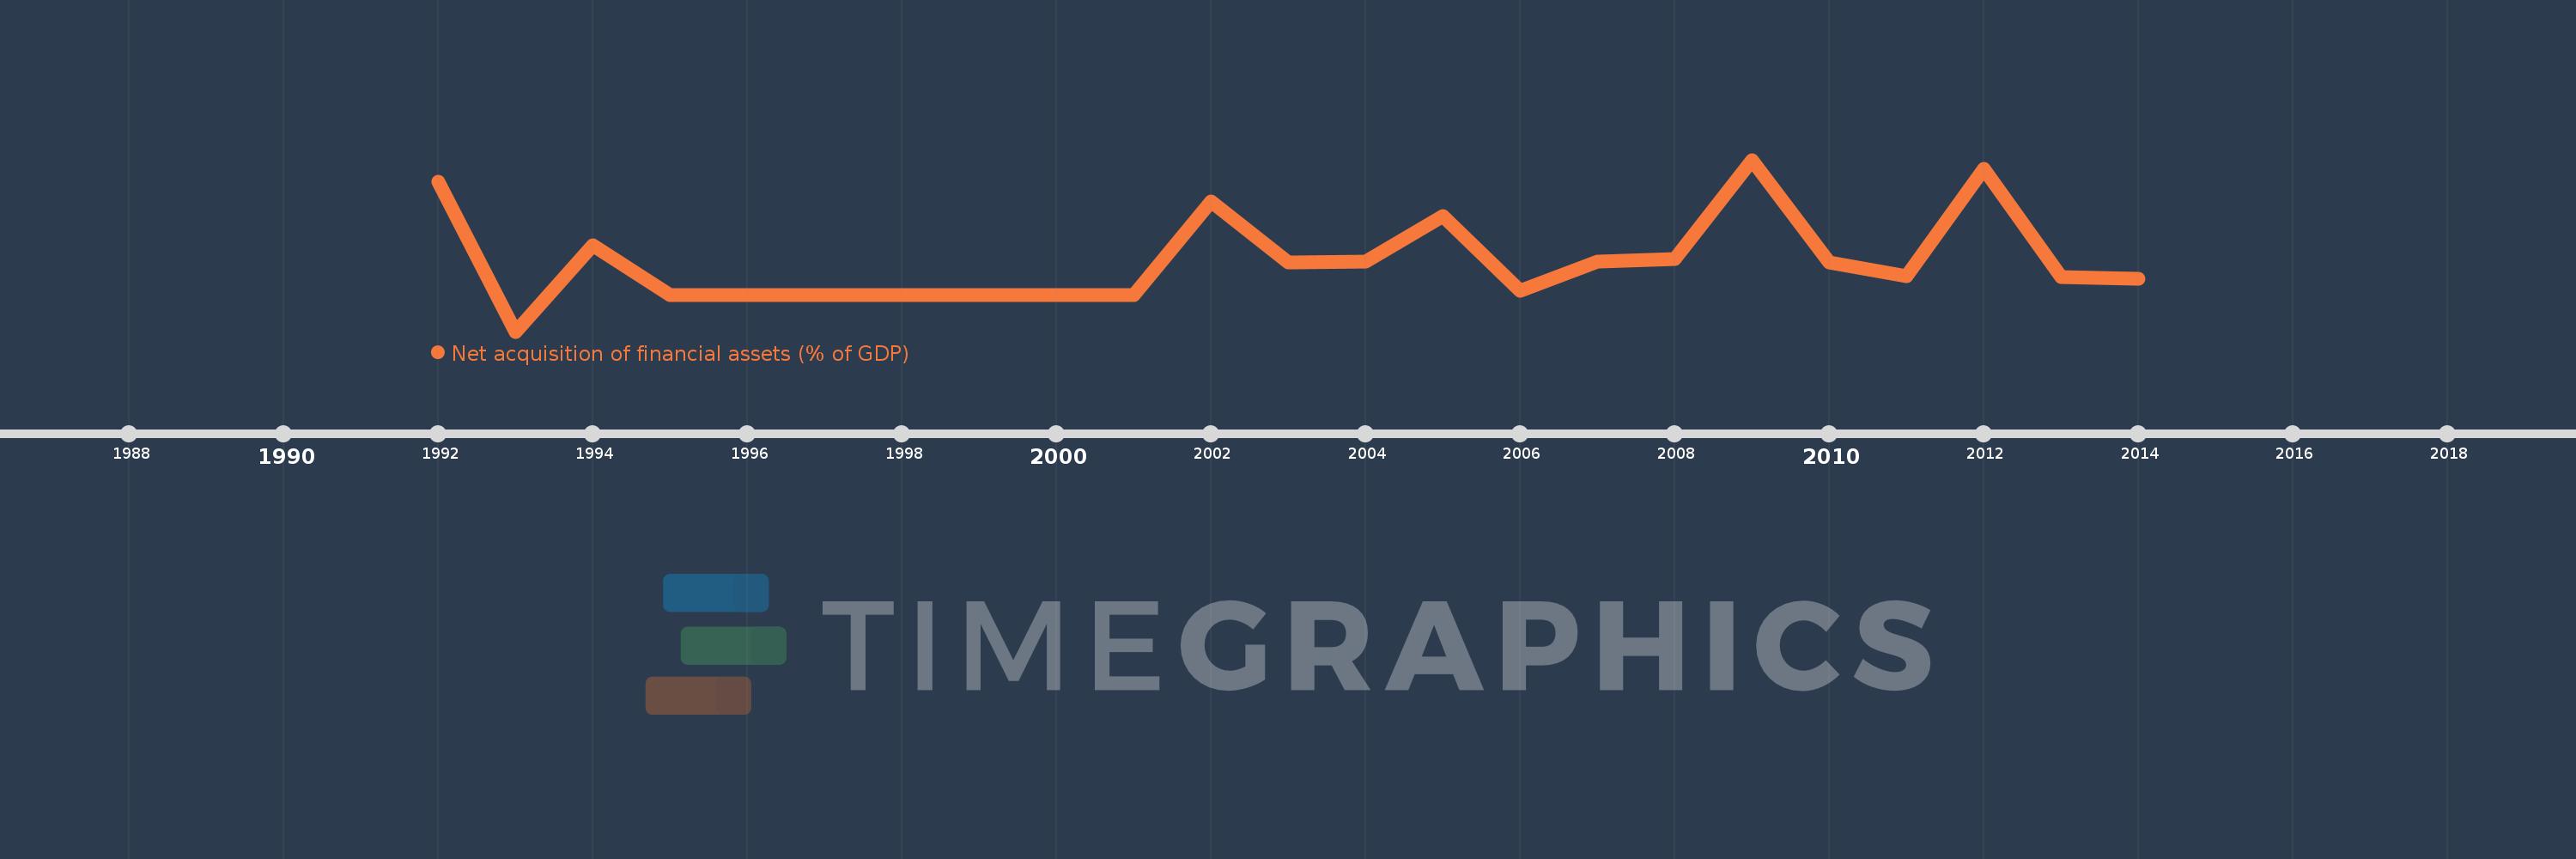
En esta escala de tiempo se presenta un gráfico de 1992 y 2014 de Hungary. Los datos de 1991 están ausentes. El número de observaciones reales por fecha: 18.
Fuente (nombre):
Indicadores del desarrollo mundial
Fuente (organización):
International Monetary Fund, Government Finance Statistics Yearbook and data files.
Categorías:
Public Sector
Se ha actualizado:
23 abr 2017 año
Los indicadores de los cambios de valor en los últimos años
En promedio:
0.009
Mínimo:
-3.977
1 ene 1993 año
Máximo:
4.56
1 ene 2009 año
A la fecha de observación
Valor
Cambio absoluto
El cambio con respecto al valor anterior
1 ene 1992 año
3.452
+3.452
0.0%
1 ene 1993 año
-3.977
-7.429
-215.19%
1 ene 1994 año
0.299
+4.276
-107.52%
1 ene 1995 año
-2.155
-2.454
-820.55%
1 ene 2001 año
-2.163
-0.008
0.37%
1 ene 2002 año
2.483
+4.646
-214.81%
1 ene 2003 año
-0.528
-3.012
-121.28%
1 ene 2004 año
-0.48
+0.049
-9.2%
1 ene 2005 año
1.779
+2.259
-470.73%
1 ene 2006 año
-1.959
-3.738
-210.14%
1 ene 2007 año
-0.514
+1.446
-73.79%
1 ene 2008 año
-0.39
+0.124
-24.1%
1 ene 2009 año
4.56
+4.95
-1.27 mil%
1 ene 2010 año
-0.522
-5.082
-111.45%
1 ene 2011 año
-1.243
-0.721
138.07%
1 ene 2012 año
4.119
+5.362
-431.43%
1 ene 2013 año
-1.255
-5.374
-130.46%
1 ene 2014 año
-1.343
-0.089
7.06%
Ranking de los países por los datos estadísticos actuales

Comentarios:

Enviar
PremiumAbout & FeedbackAcuerdoPrivacidad
logo
© 2022 Selected Technologies LLC – Morgan Hill, California