29
/es/
es
AIzaSyAYiBZKx7MnpbEhh9jyipgxe19OcubqV5w
April 1, 2024
176716
Lebanon
LBN
true
2
1
Net acquisition of financial assets (% of GDP)
2016,2015,2014,2013,2012,2011,2010,2009,2008,2007,2006,2005,2004,2003,2002,2001,2000,1999,1998
Download
Estadísticas Globales de la Biblioteca →Lebanon →

Net acquisition of financial assets (% of GDP)

Estas estadísticas en otros países:
AfghanistanAlbaniaAlgeriaAngolaAntigua and BarbudaArmeniaAustraliaAustriaAzerbaijanBahrainBangladeshBarbadosBelarusBelgiumBelizeBeninBhutanBoliviaBosnia and HerzegovinaBrazilBurkina FasoBurundiCabo VerdeCambodiaCanadaCaribbean small statesCentral African RepublicCentral Europe and the BalticsChileColombiaCongo, Dem. Rep.Congo, Rep.Cote d'IvoireCroatiaCyprusCzech RepublicDominicaDominican RepublicEgypt, Arab Rep.El SalvadorEquatorial GuineaEstoniaEthiopiaEuro areaEurope & Central Asia (excluding high income)Europe & Central Asia (IDA & IBRD countries)European UnionFijiFinlandFranceGeorgiaGermanyGhanaGuatemalaHigh incomeHondurasHong Kong SAR, ChinaHungaryIcelandIndiaIndonesiaIran, Islamic Rep.IraqIrelandIsraelItalyJamaicaJapanJordanKazakhstanKiribatiKorea, Rep.Kyrgyz RepublicLao PDRLebanonLesothoLithuaniaLow incomeLower middle incomeLuxembourgMacao SAR, ChinaMacedonia, FYRMadagascarMalawiMalaysiaMaldivesMaliMaltaMauritiusMicronesia, Fed. Sts.Middle East & North Africa (excluding high income)Middle East & North Africa (IDA & IBRD countries)MoldovaMongoliaMoroccoMozambiqueNamibiaNepalNetherlandsNew ZealandNigeriaNorth AmericaNorwayOECD membersOmanPacific island small statesParaguayPeruPhilippinesPolandPortugalPost-demographic dividendRomaniaRussian FederationRwandaSamoaSan MarinoSao Tome and PrincipeSenegalSerbiaSeychellesSingaporeSlovak RepublicSolomon IslandsSouth AfricaSouth AsiaSouth Asia (IDA & IBRD)SpainSri LankaSt. Kitts and NevisSub-Saharan Africa Sub-Saharan Africa (excluding high income)Sub-Saharan Africa (IDA & IBRD countries)SurinameSwazilandSwitzerlandSyrian Arab RepublicTanzaniaThailandTimor-LesteTogoTrinidad and TobagoTurkeyUgandaUkraineUnited Arab EmiratesUnited KingdomUnited StatesUruguayVanuatuVietnamWest Bank and GazaZimbabwe
línea de tiempo (timeline):
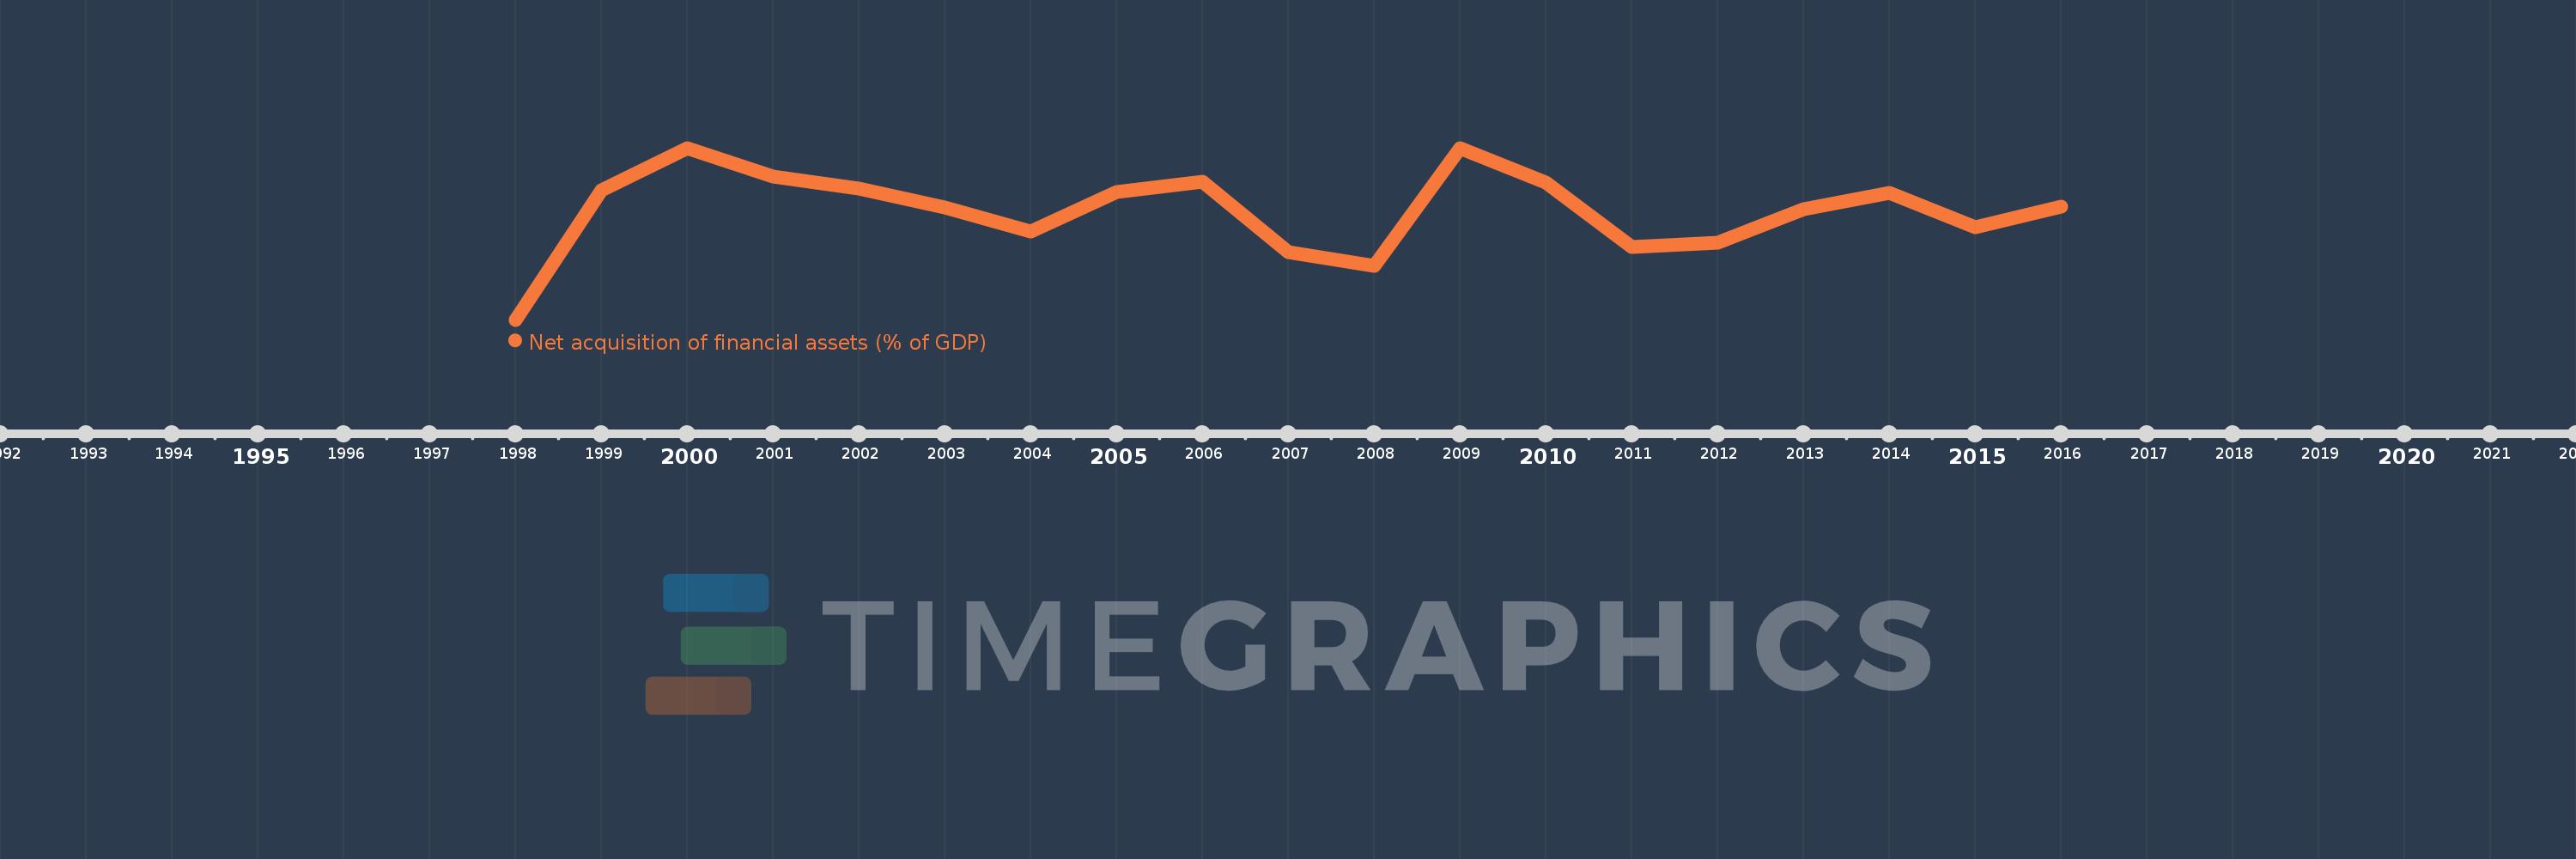
En esta escala de tiempo se presenta un gráfico de 1998 y 2016 de Lebanon. Los datos de 1997 están ausentes. El número de observaciones reales por fecha: 19.
Fuente (nombre):
Indicadores del desarrollo mundial
Fuente (organización):
International Monetary Fund, Government Finance Statistics Yearbook and data files.
Categorías:
Public Sector
Se ha actualizado:
23 abr 2017 año
Los indicadores de los cambios de valor en los últimos años
En promedio:
0.761
Mínimo:
-10.163
1 ene 1998 año
Máximo:
7.109
1 ene 2000 año
A la fecha de observación
Valor
Cambio absoluto
El cambio con respecto al valor anterior
1 ene 1998 año
-10.163
-10.163
0.0%
1 ene 1999 año
2.814
+12.978
-127.69%
1 ene 2000 año
7.109
+4.295
152.62%
1 ene 2001 año
4.197
-2.912
-40.96%
1 ene 2002 año
3.059
-1.139
-27.13%
1 ene 2003 año
1.086
-1.973
-64.5%
1 ene 2004 año
-1.3
-2.386
-219.73%
1 ene 2005 año
2.696
+3.997
-307.4%
1 ene 2006 año
3.69
+0.994
36.86%
1 ene 2007 año
-3.356
-7.046
-190.93%
1 ene 2008 año
-4.744
-1.388
41.38%
1 ene 2009 año
7.108
+11.852
-249.84%
1 ene 2010 año
3.631
-3.478
-48.92%
1 ene 2011 año
-2.883
-6.514
-179.4%
1 ene 2012 año
-2.376
+0.507
-17.58%
1 ene 2013 año
0.936
+3.312
-139.4%
1 ene 2014 año
2.595
+1.658
177.13%
1 ene 2015 año
-0.893
-3.487
-134.4%
1 ene 2016 año
1.252
+2.145
-240.32%
Ranking de los países por los datos estadísticos actuales

Comentarios:

Enviar
PremiumAbout & FeedbackAcuerdoPrivacidad
logo
© 2022 Selected Technologies LLC – Morgan Hill, California